Chapter 9 Model iterations
Based on our exploratory analysis we have developed the three following spatial models
- 5 Area Merge EY/WY/SouthEast into a single EGOA region
- 3 Area Merge Bering Sea, Aleutian Islands, and Western Gulf into a single region. This model is the same as Fenske (2022)
- 1 Area merge all regions
Single Area model
Due to the focus on spatial assessment models for this research, some data sets that are in the current assessment were dropped during initial model development. These included, early Japanese fishery CPUE, early Japanese Length frequency observations and the NFMS trawl survey. The early Japanese data was dropped because it could not be disaggregated by sex or space. The trawl survey was initially not included because we believe that we have sufficient information from the longline survey and the trawl survey does not monitor the core sablefish depth range, which was thought to possibly introduce data conflict due to sampling variation which we wanted to minimize.
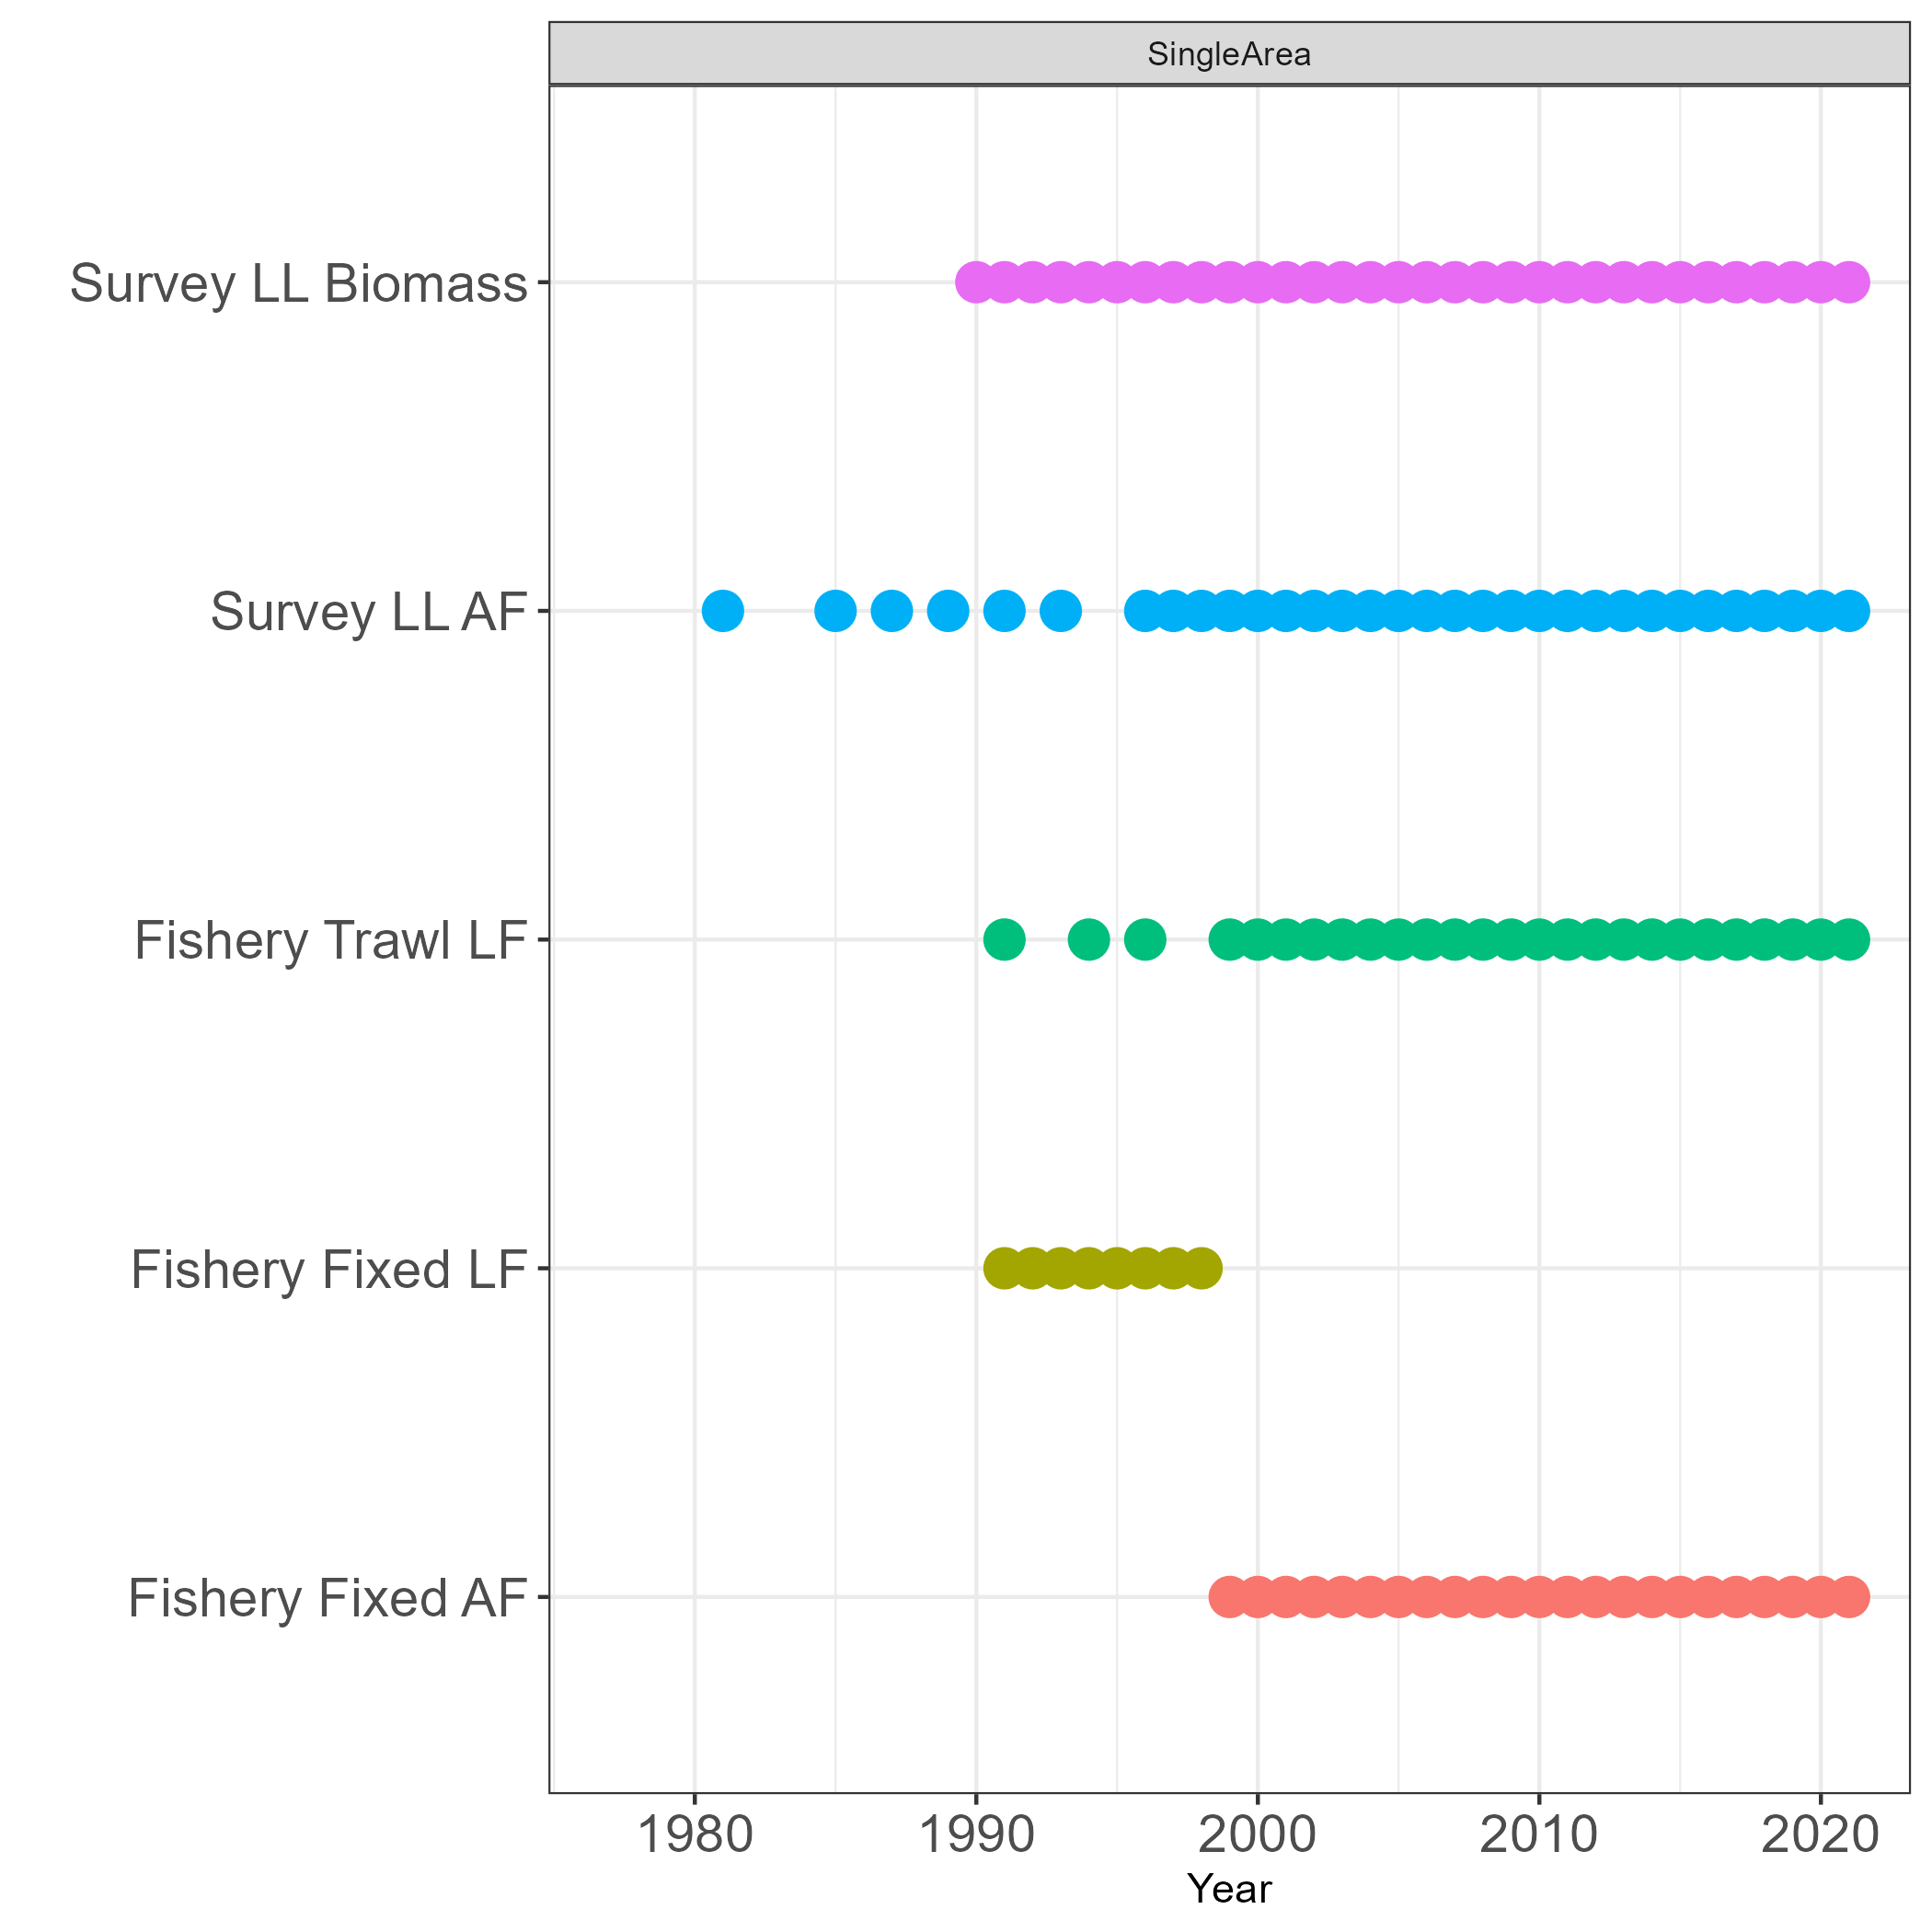
Figure 9.1: Observation frequency assumed in the SpatialSablefishAssessment (SSA) model
As a validation step, we compare SpatialSablefishAssessment which was developed for this research with the 2021 stock assessment (D. Goethel et al. 2021) (Not the exact assessment model as I made some changes/fixes).
There are a few fundamental differences between these assessment models, which are listed below
Start year 1977. Because
SpatialSablefishAssessmentdoes not have that early data. The model would not converge if started in 1960No temporal overlap in age and length composition. The current stock assessment model provides age composition (aggregated by sex) and length composition (disaggregated by sex) simultaneously in years for the longline survey and fixed gear fishery. Because we use the age-length key method to derive age-frequencies, that treatment was thought to be inappropriate due to the double use of the length data.
Age and Length composition are sexually disaggregated. As described in Chapter 16 we assume for an observation in a year that composition sum to one over sex and age.
Slightly different treatment of initial age deviations for non-equilibrium age-structure
Fishing mortality are catch conditioned and not estimated as free parameters
An initial fishing mortality parameter was estimated as a free parameter. The current assessment assumes 10% of the estimated average fixed gear fishing mortality
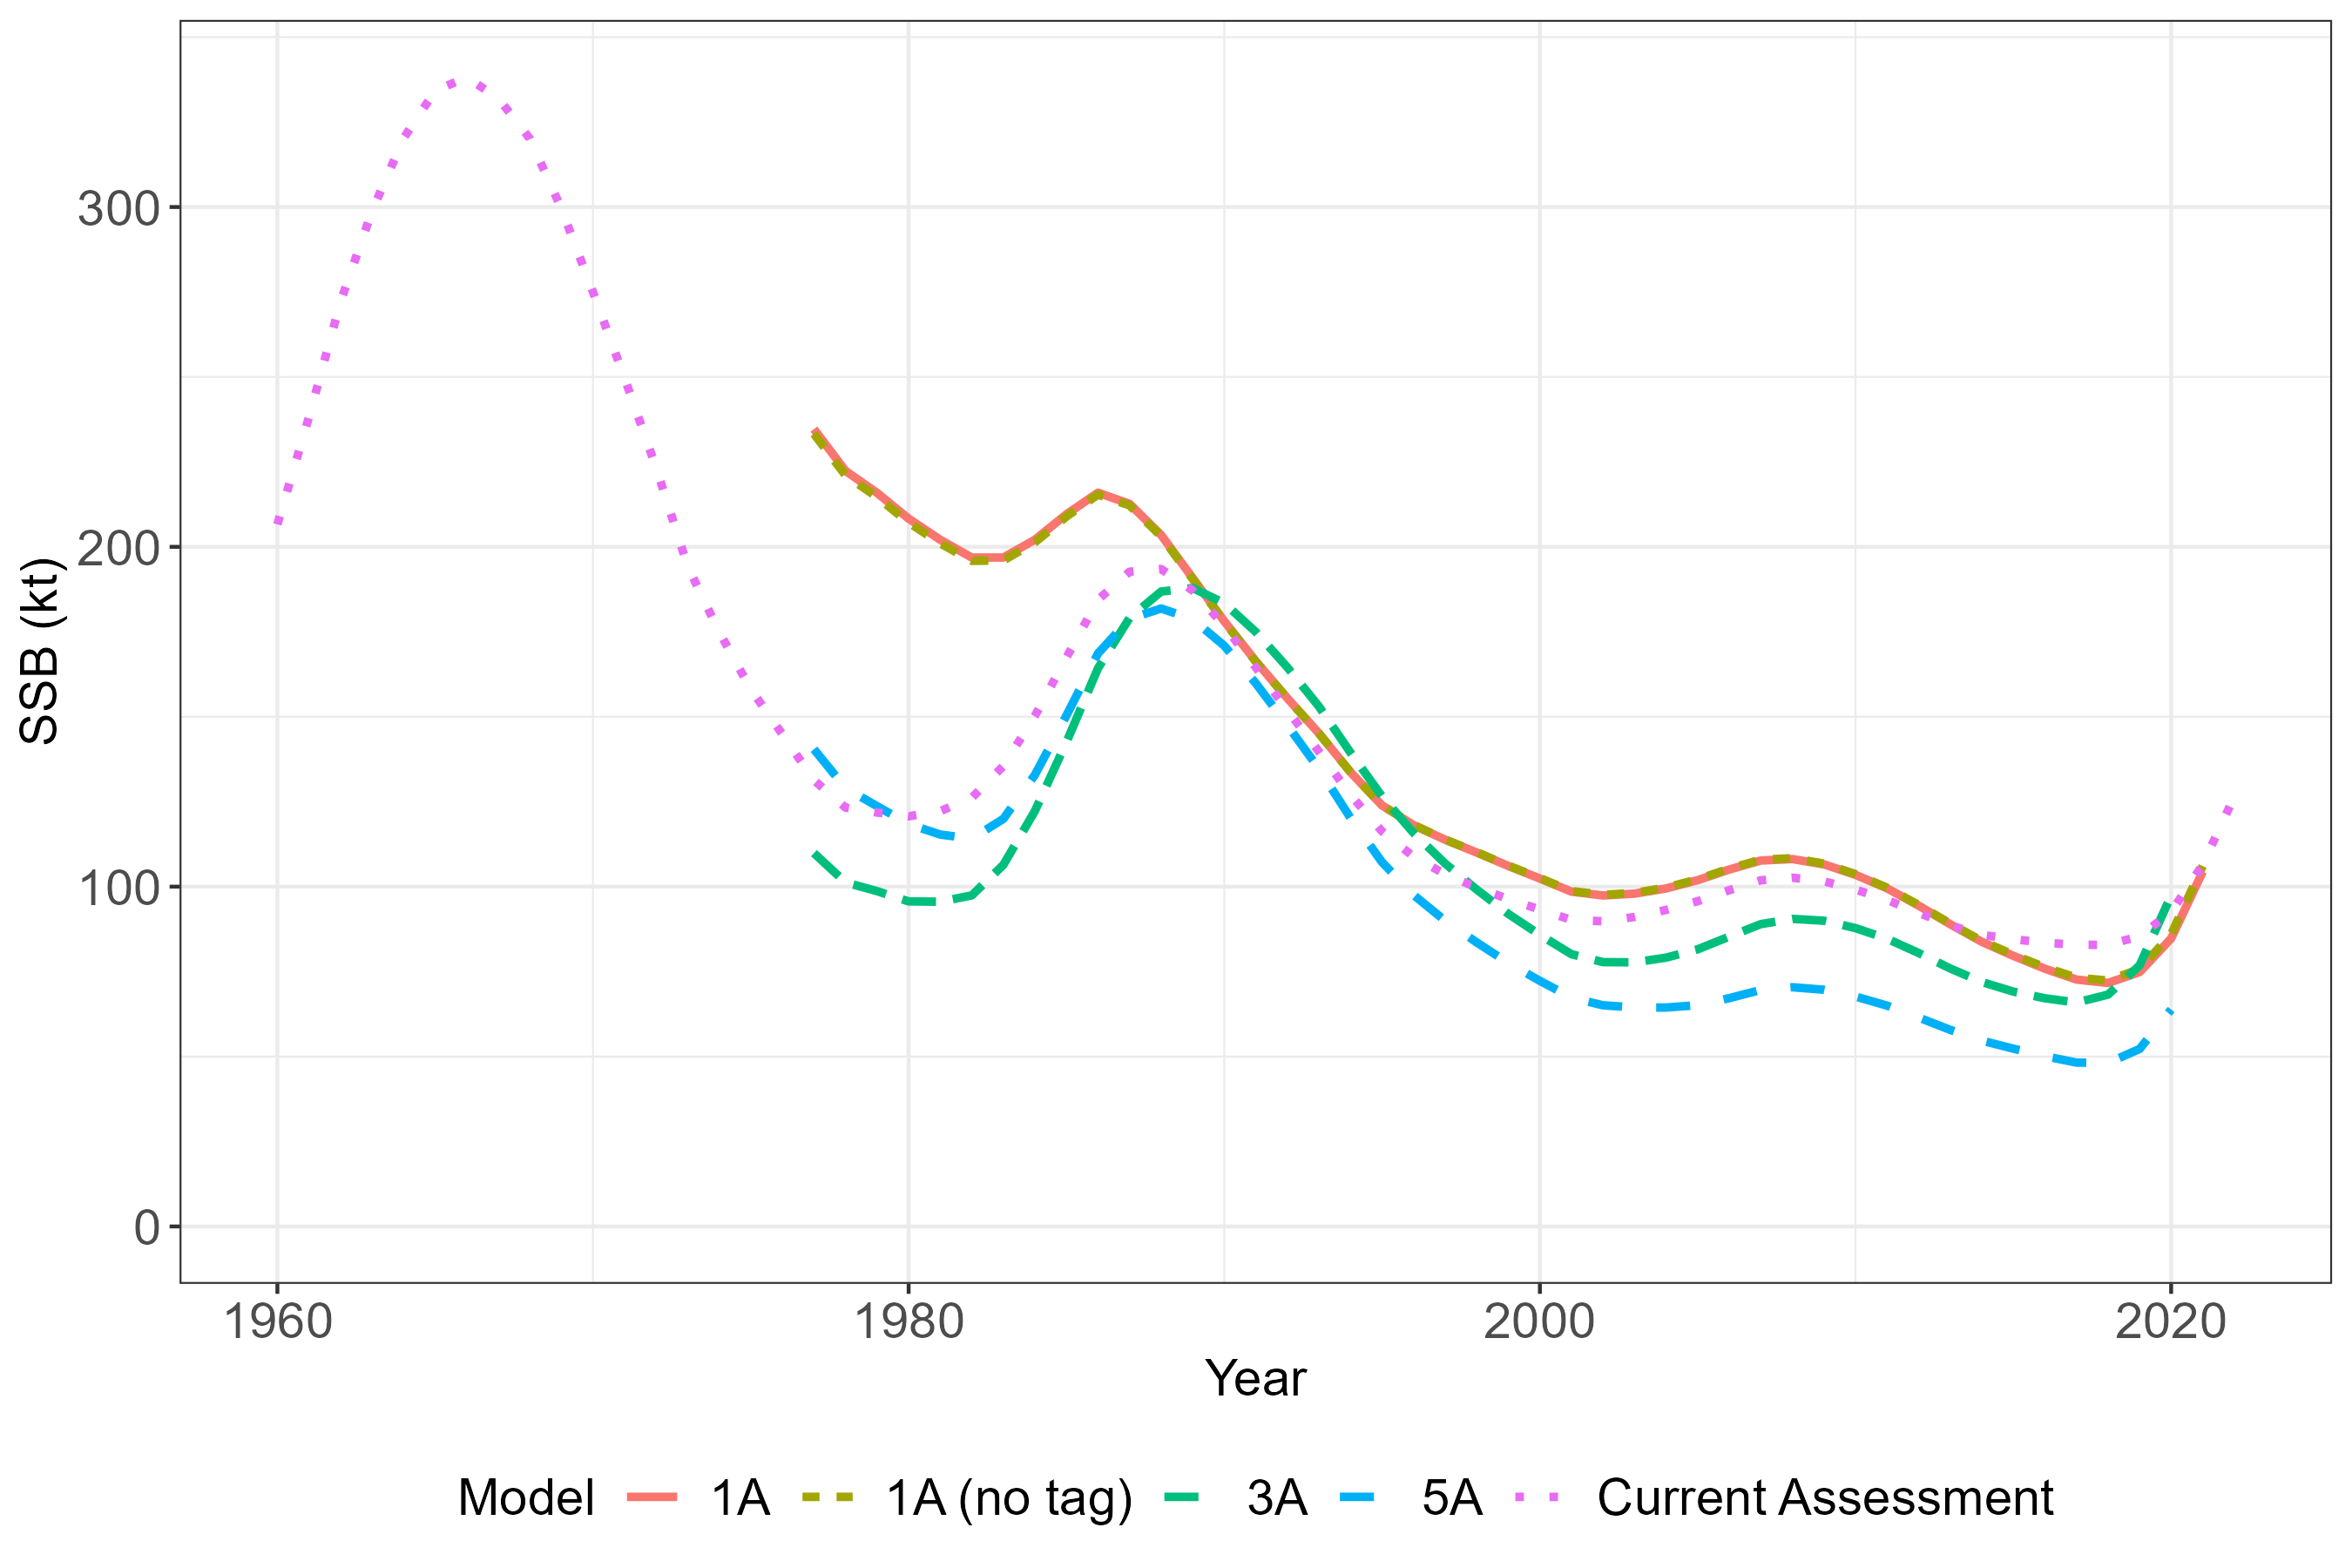
Even with the differences stated above, the models produced similar estimated model quantities in comparable years.
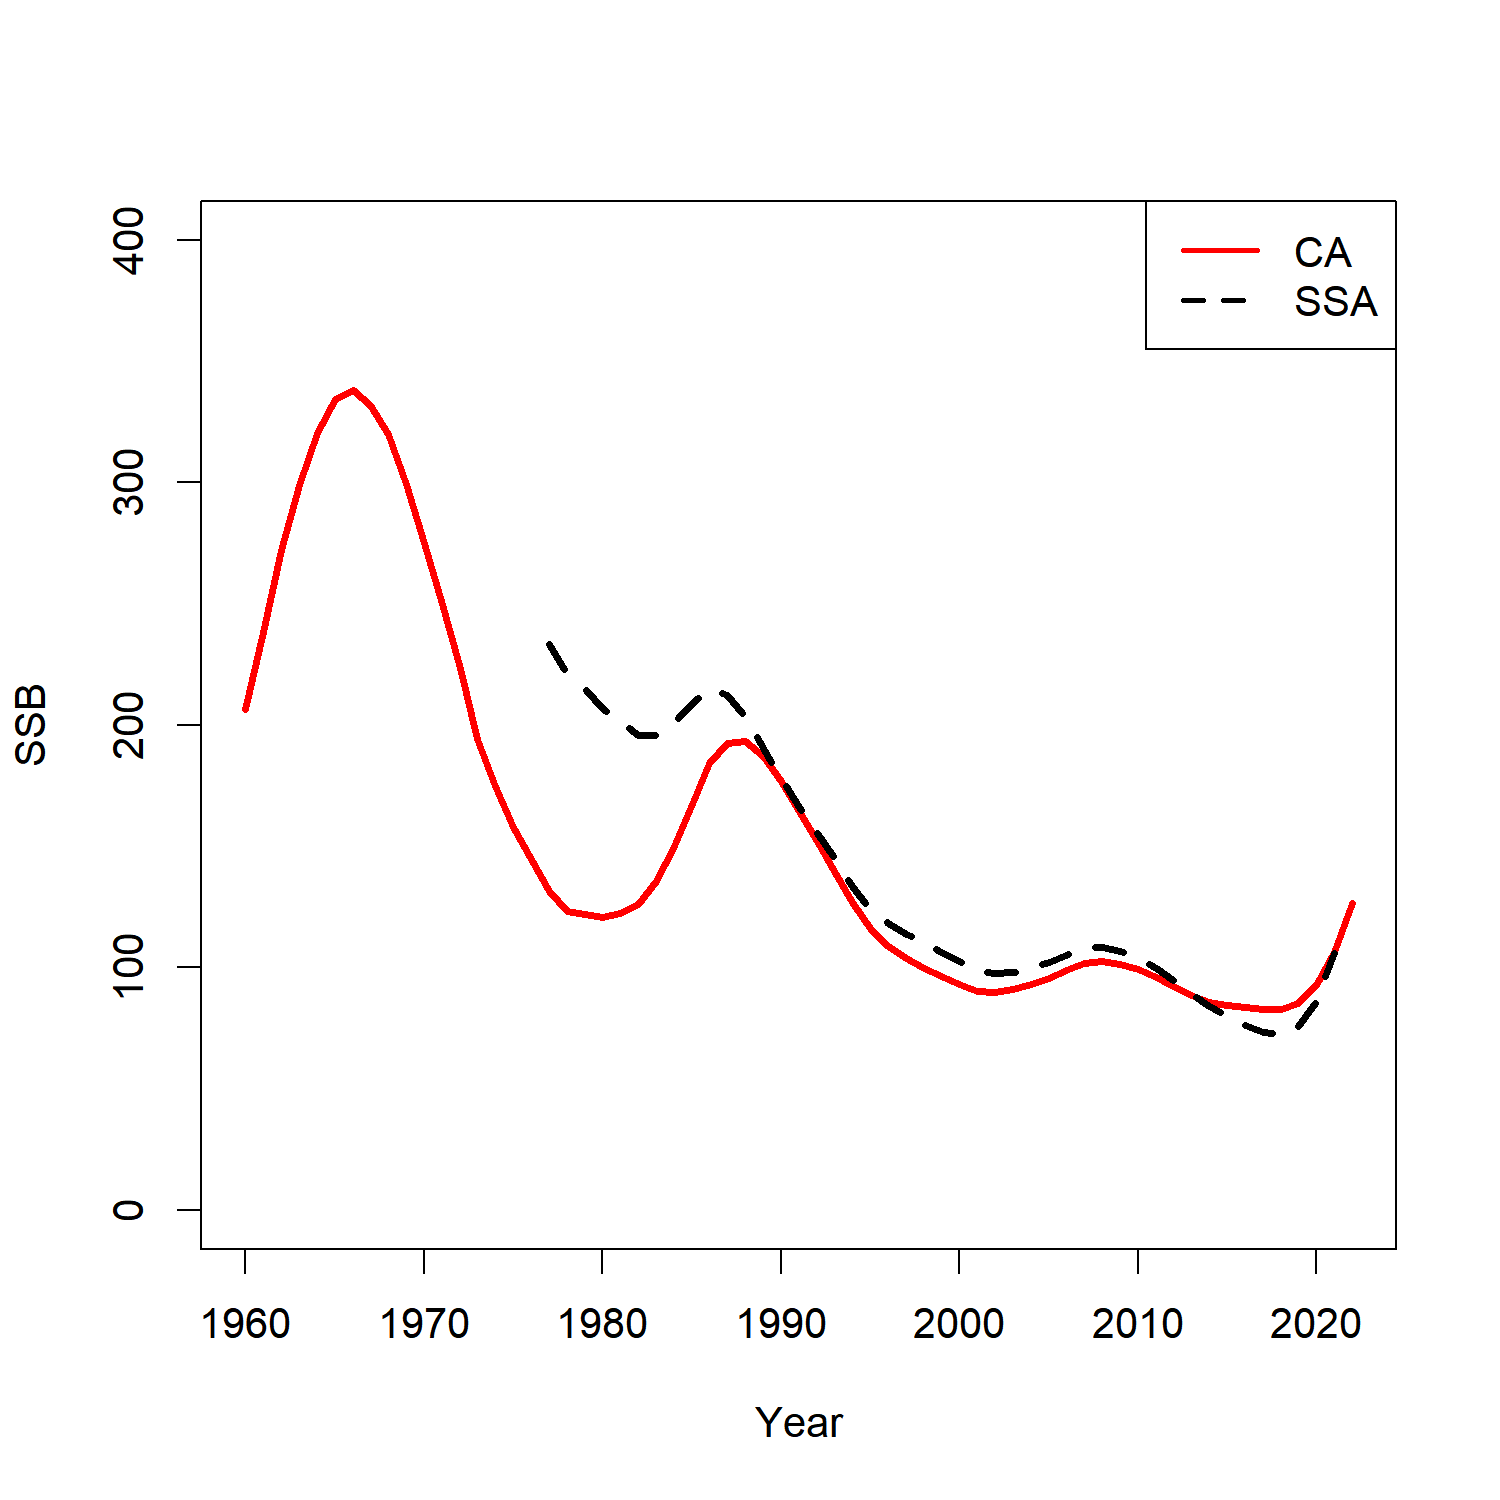
Figure 9.2: Estimated SSB (kt) between the current assessment (CA) and SpatialSablefishAssessment (SSA)
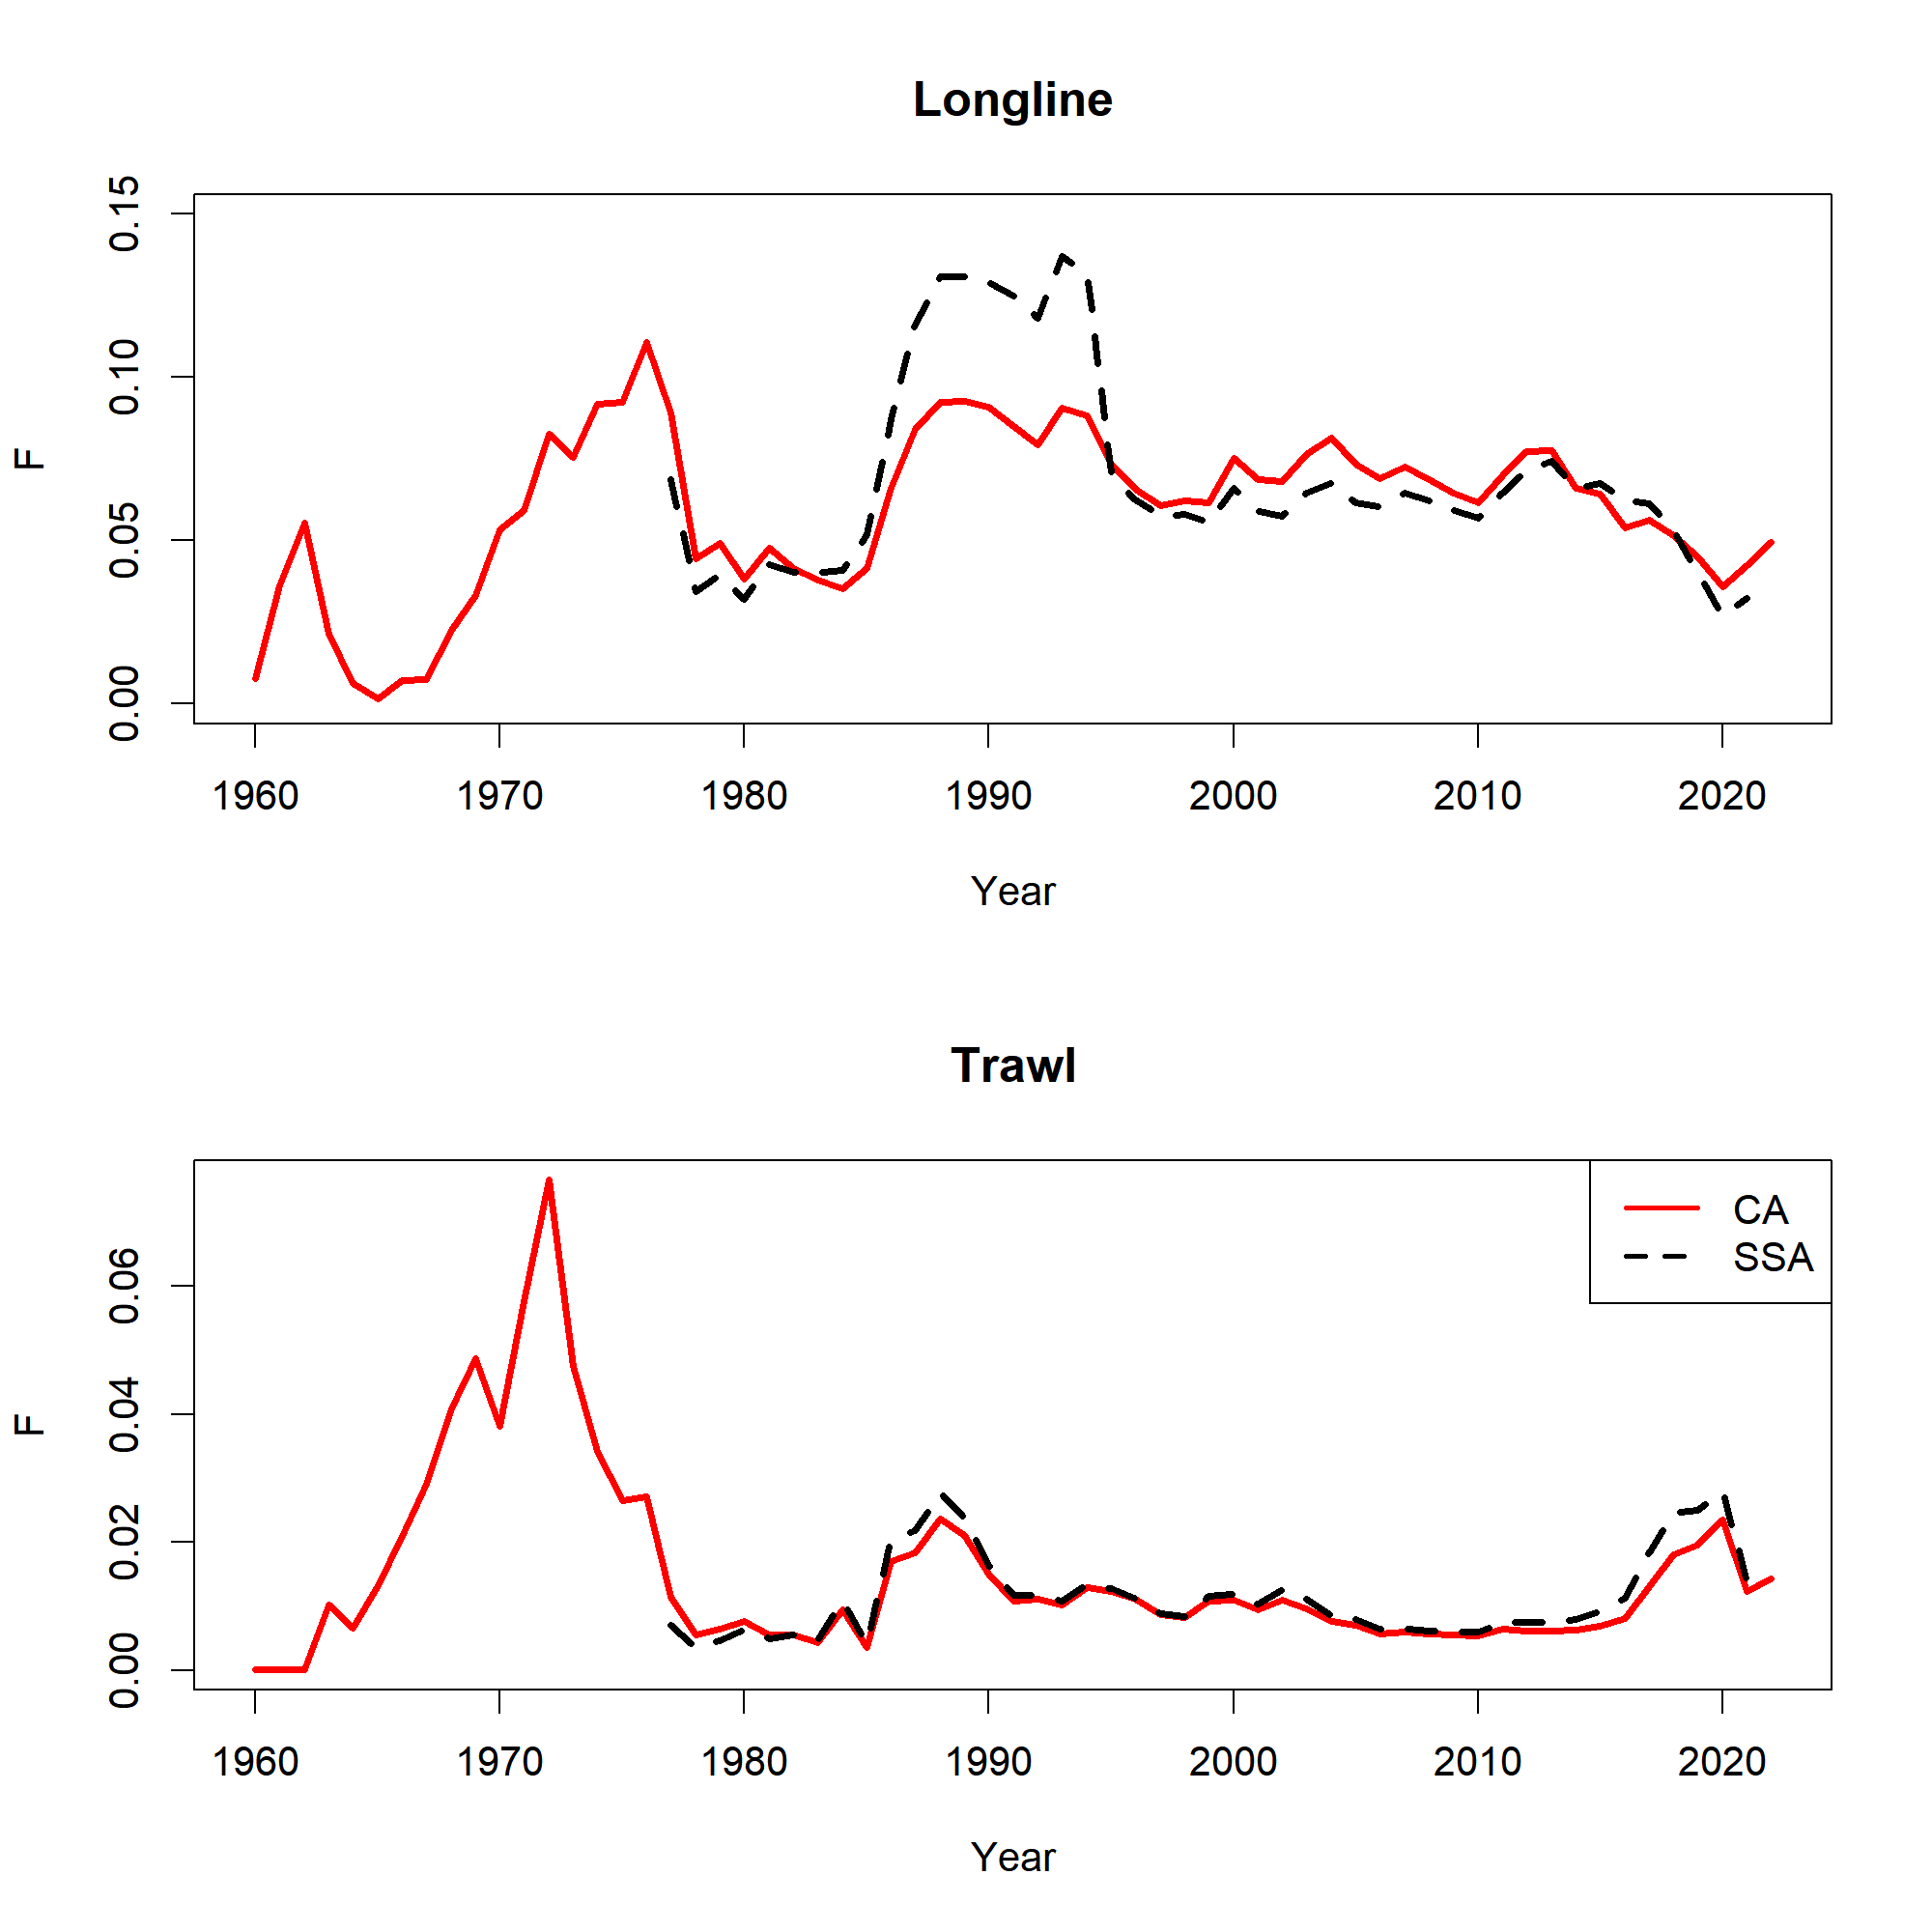
Figure 9.3: Estimated fishing mortality between the current assessment (CA) and SpatialSablefishAssessment (SSA)
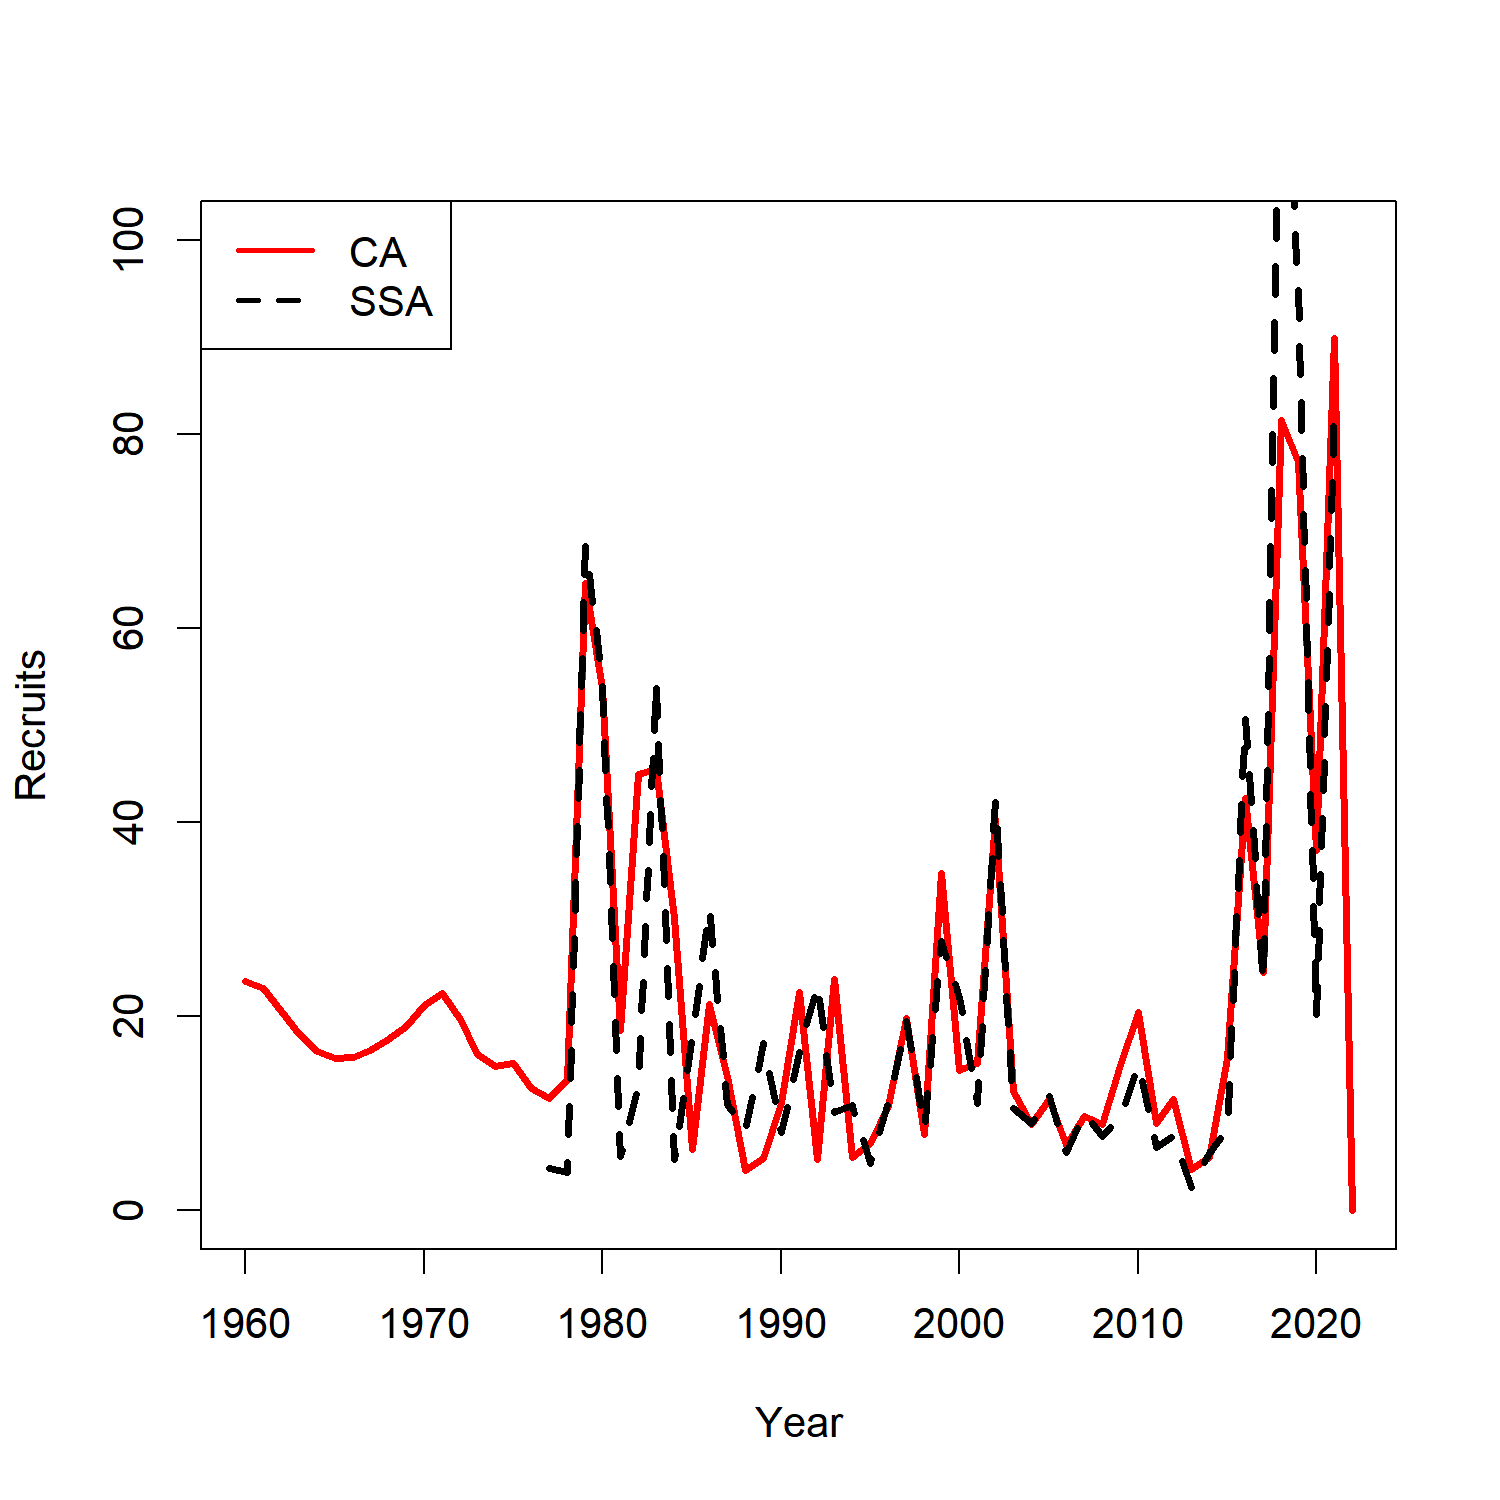
Figure 9.4: Estimated recruitment between the current assessment (CA) and SpatialSablefishAssessment (SSA)
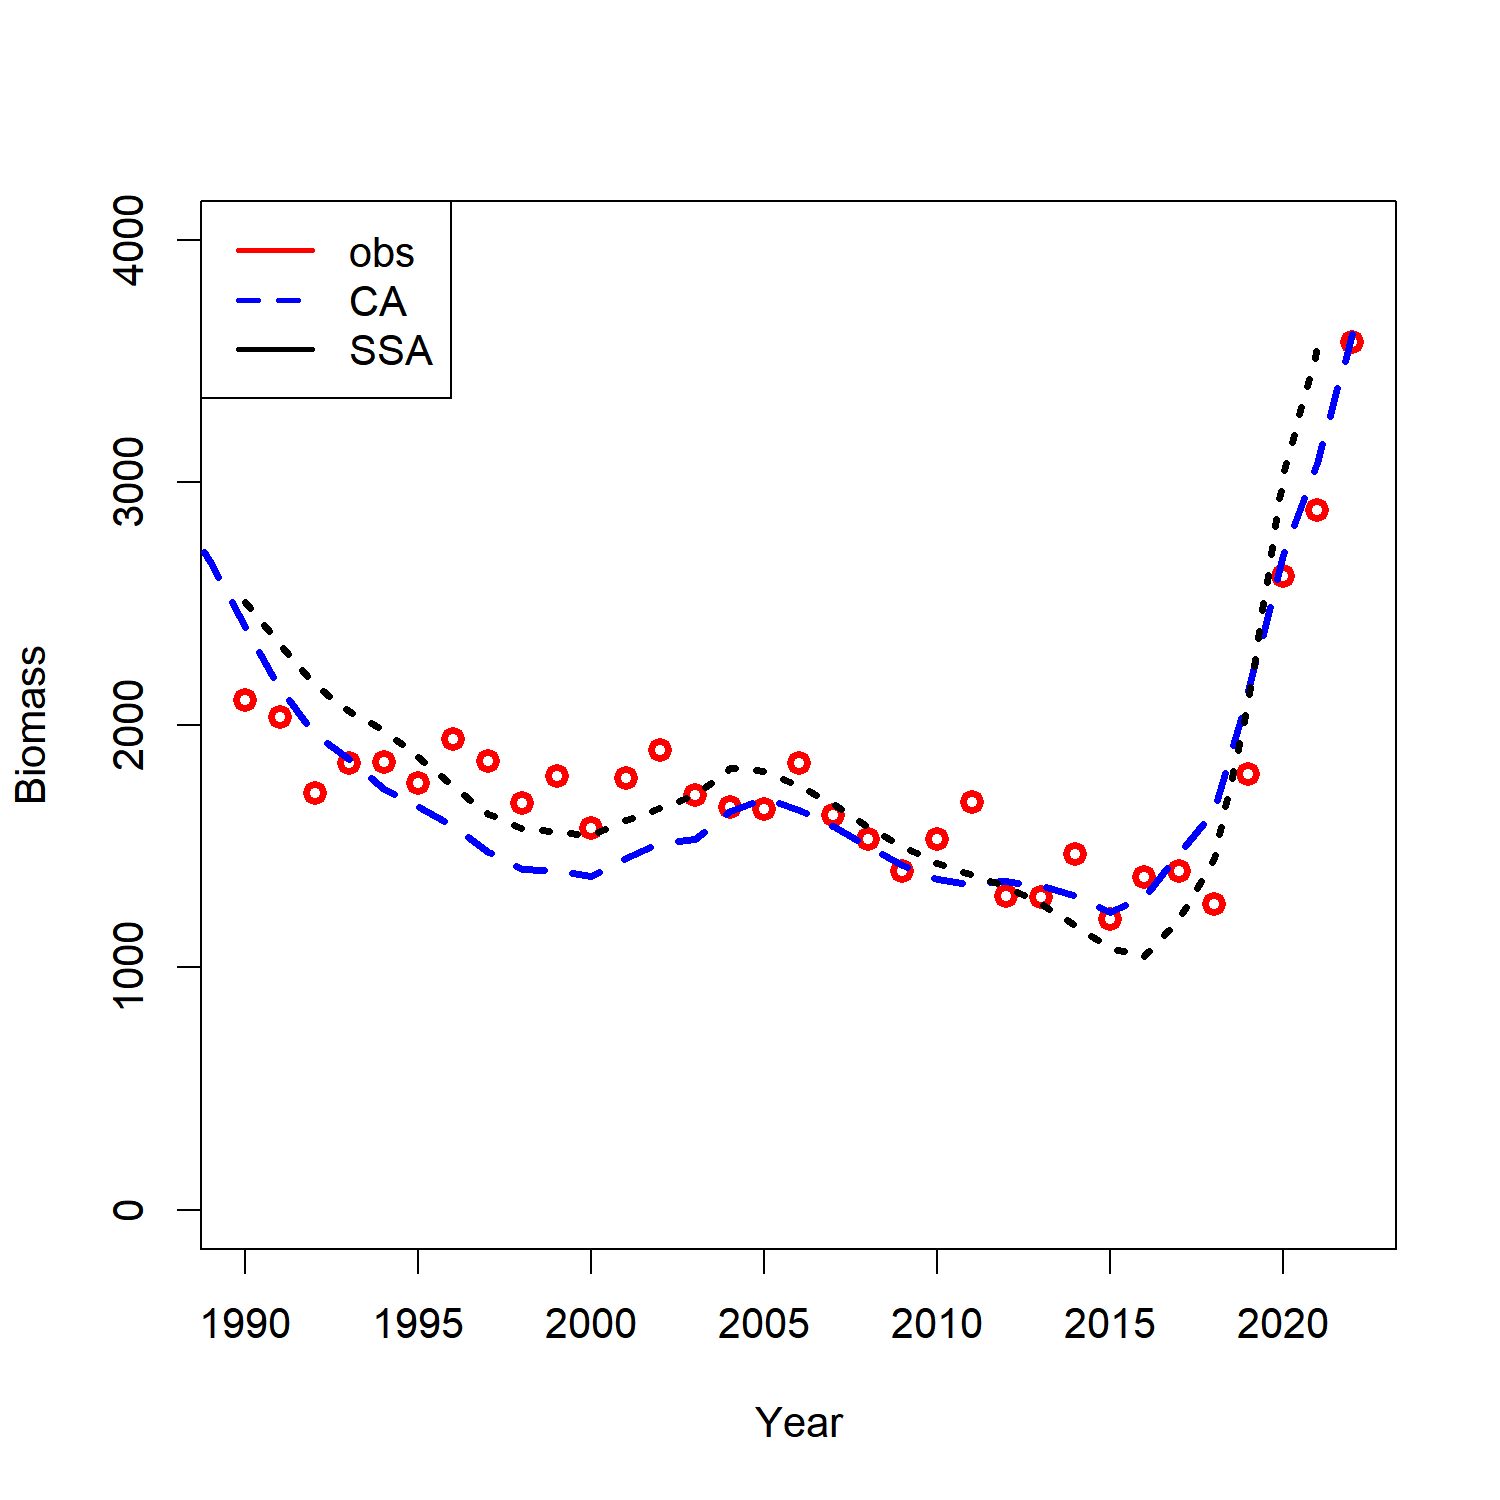
Figure 9.5: Compare fits to the survey biomass observation between current assessment (CA) and SpatialSablefishAssessment (SSA)
Three area model
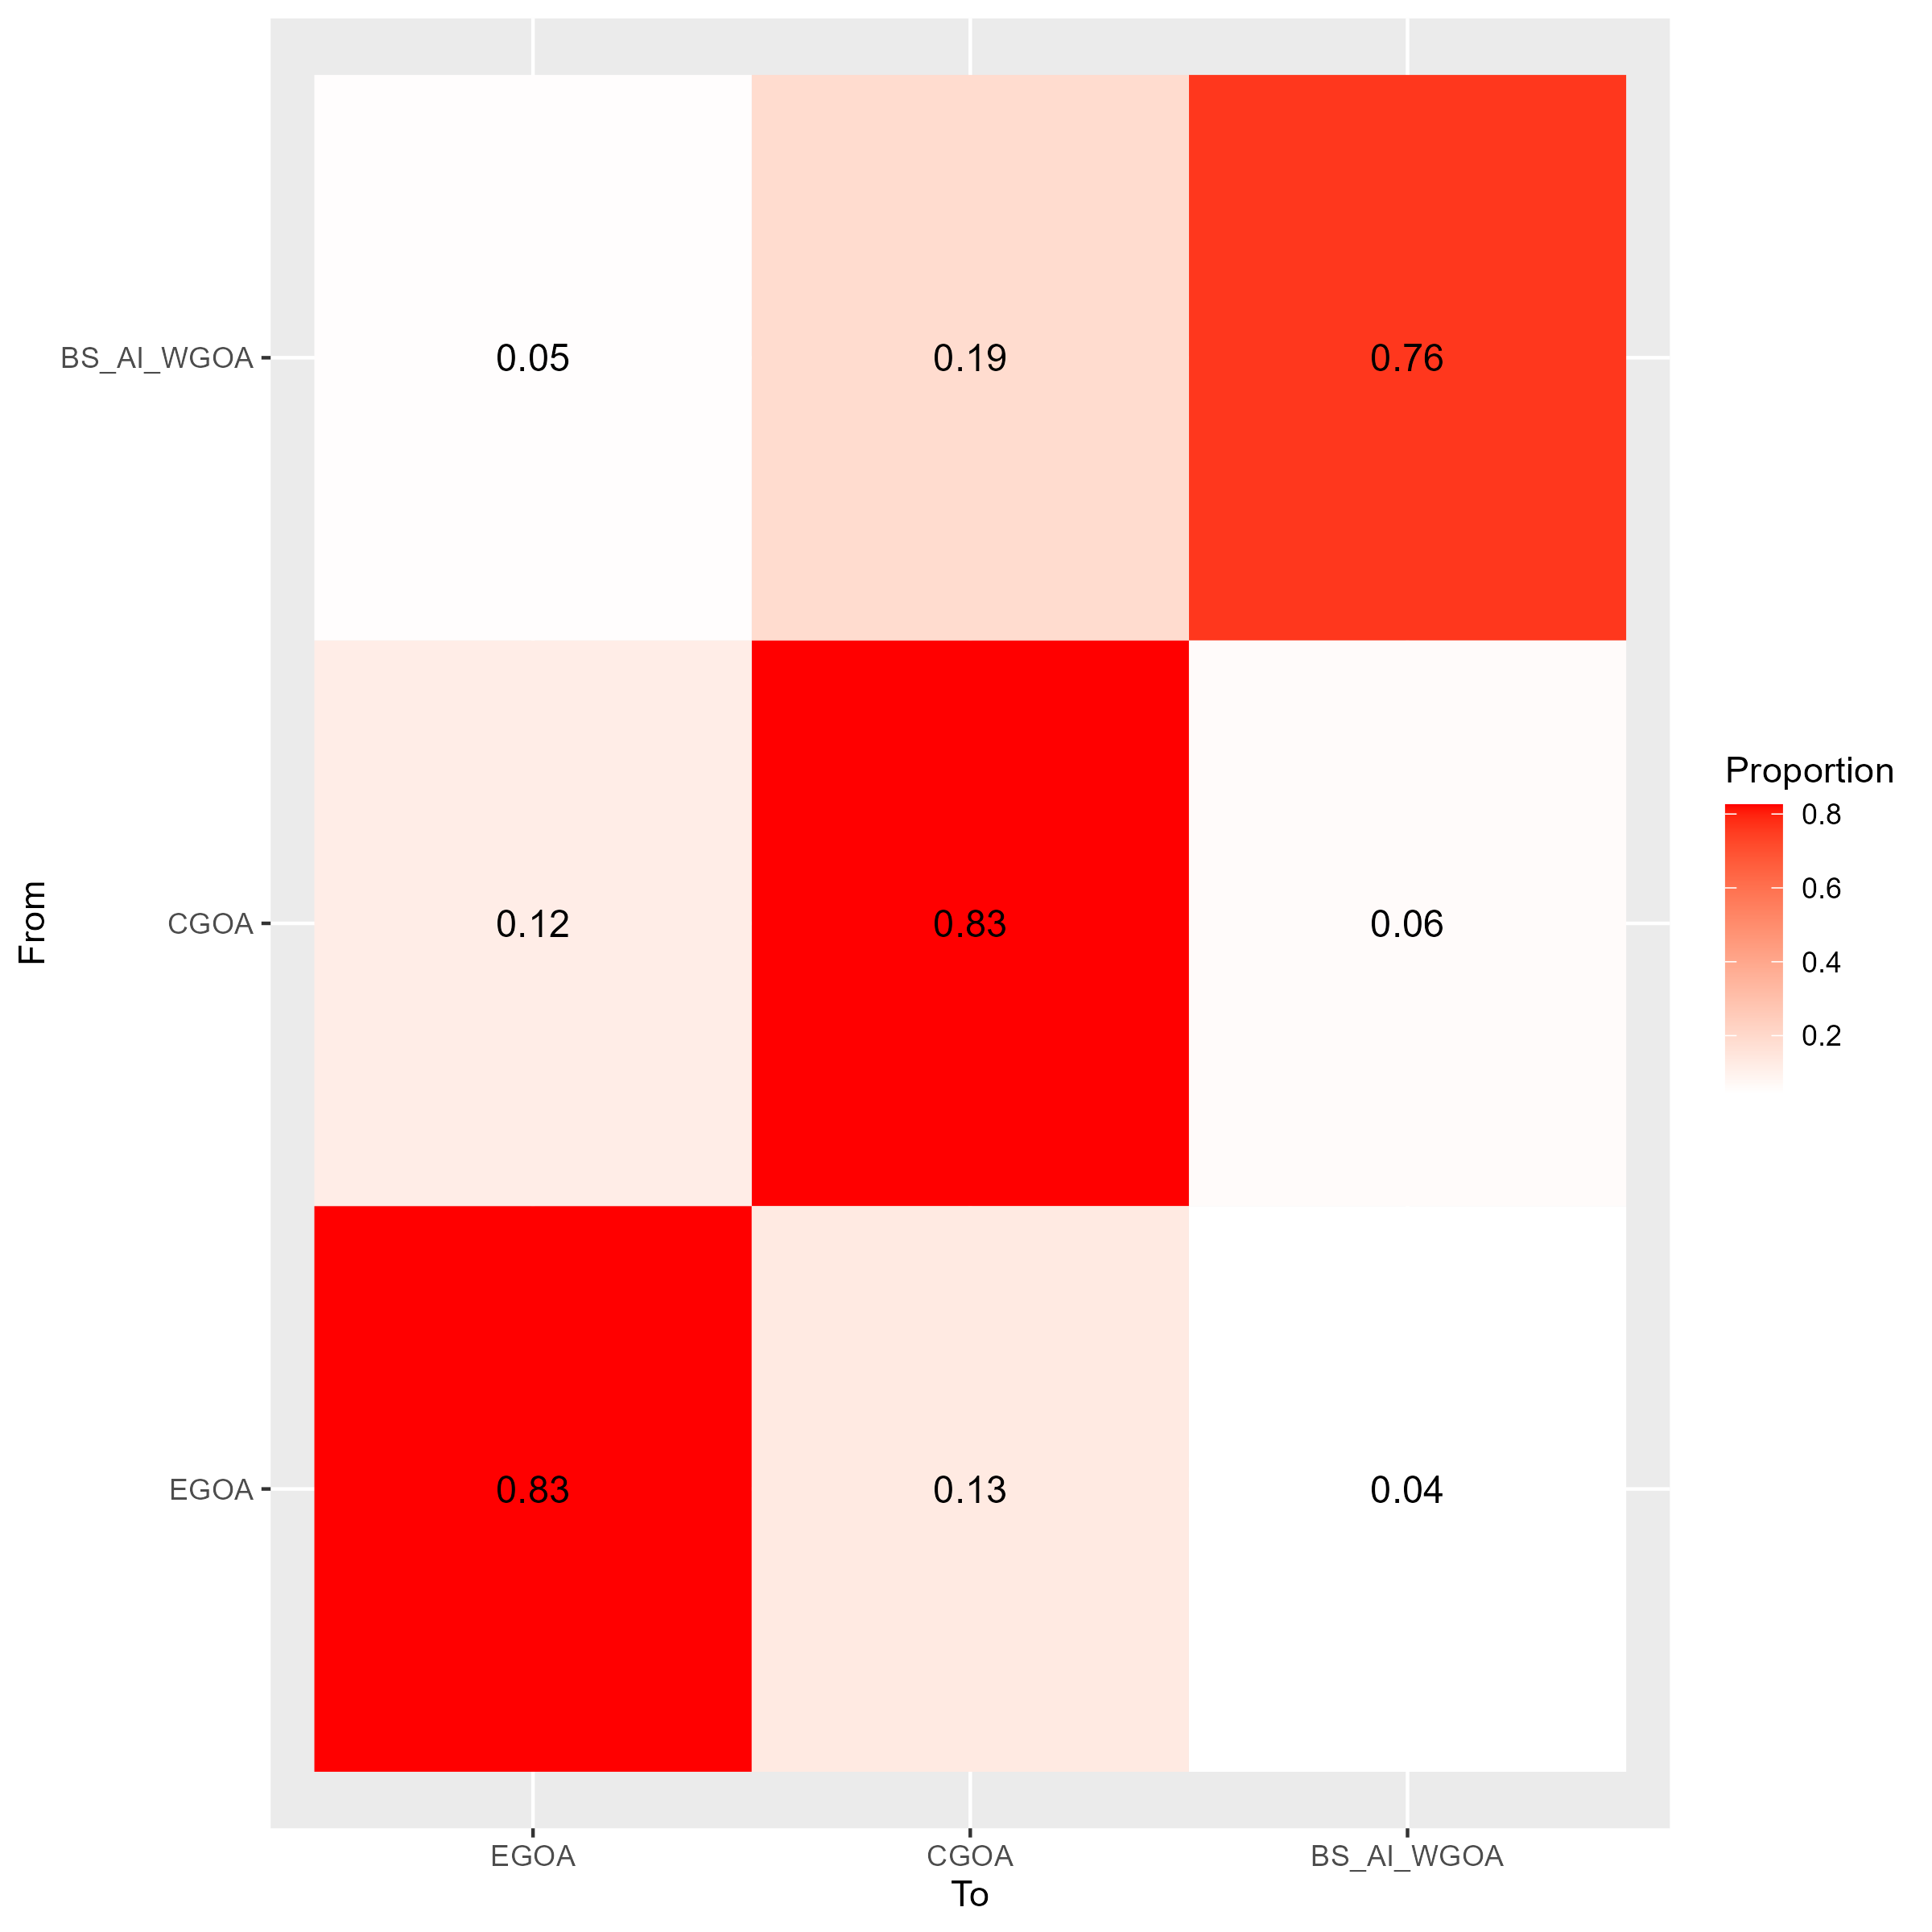
Figure 9.7: Estimated movement in the three region model
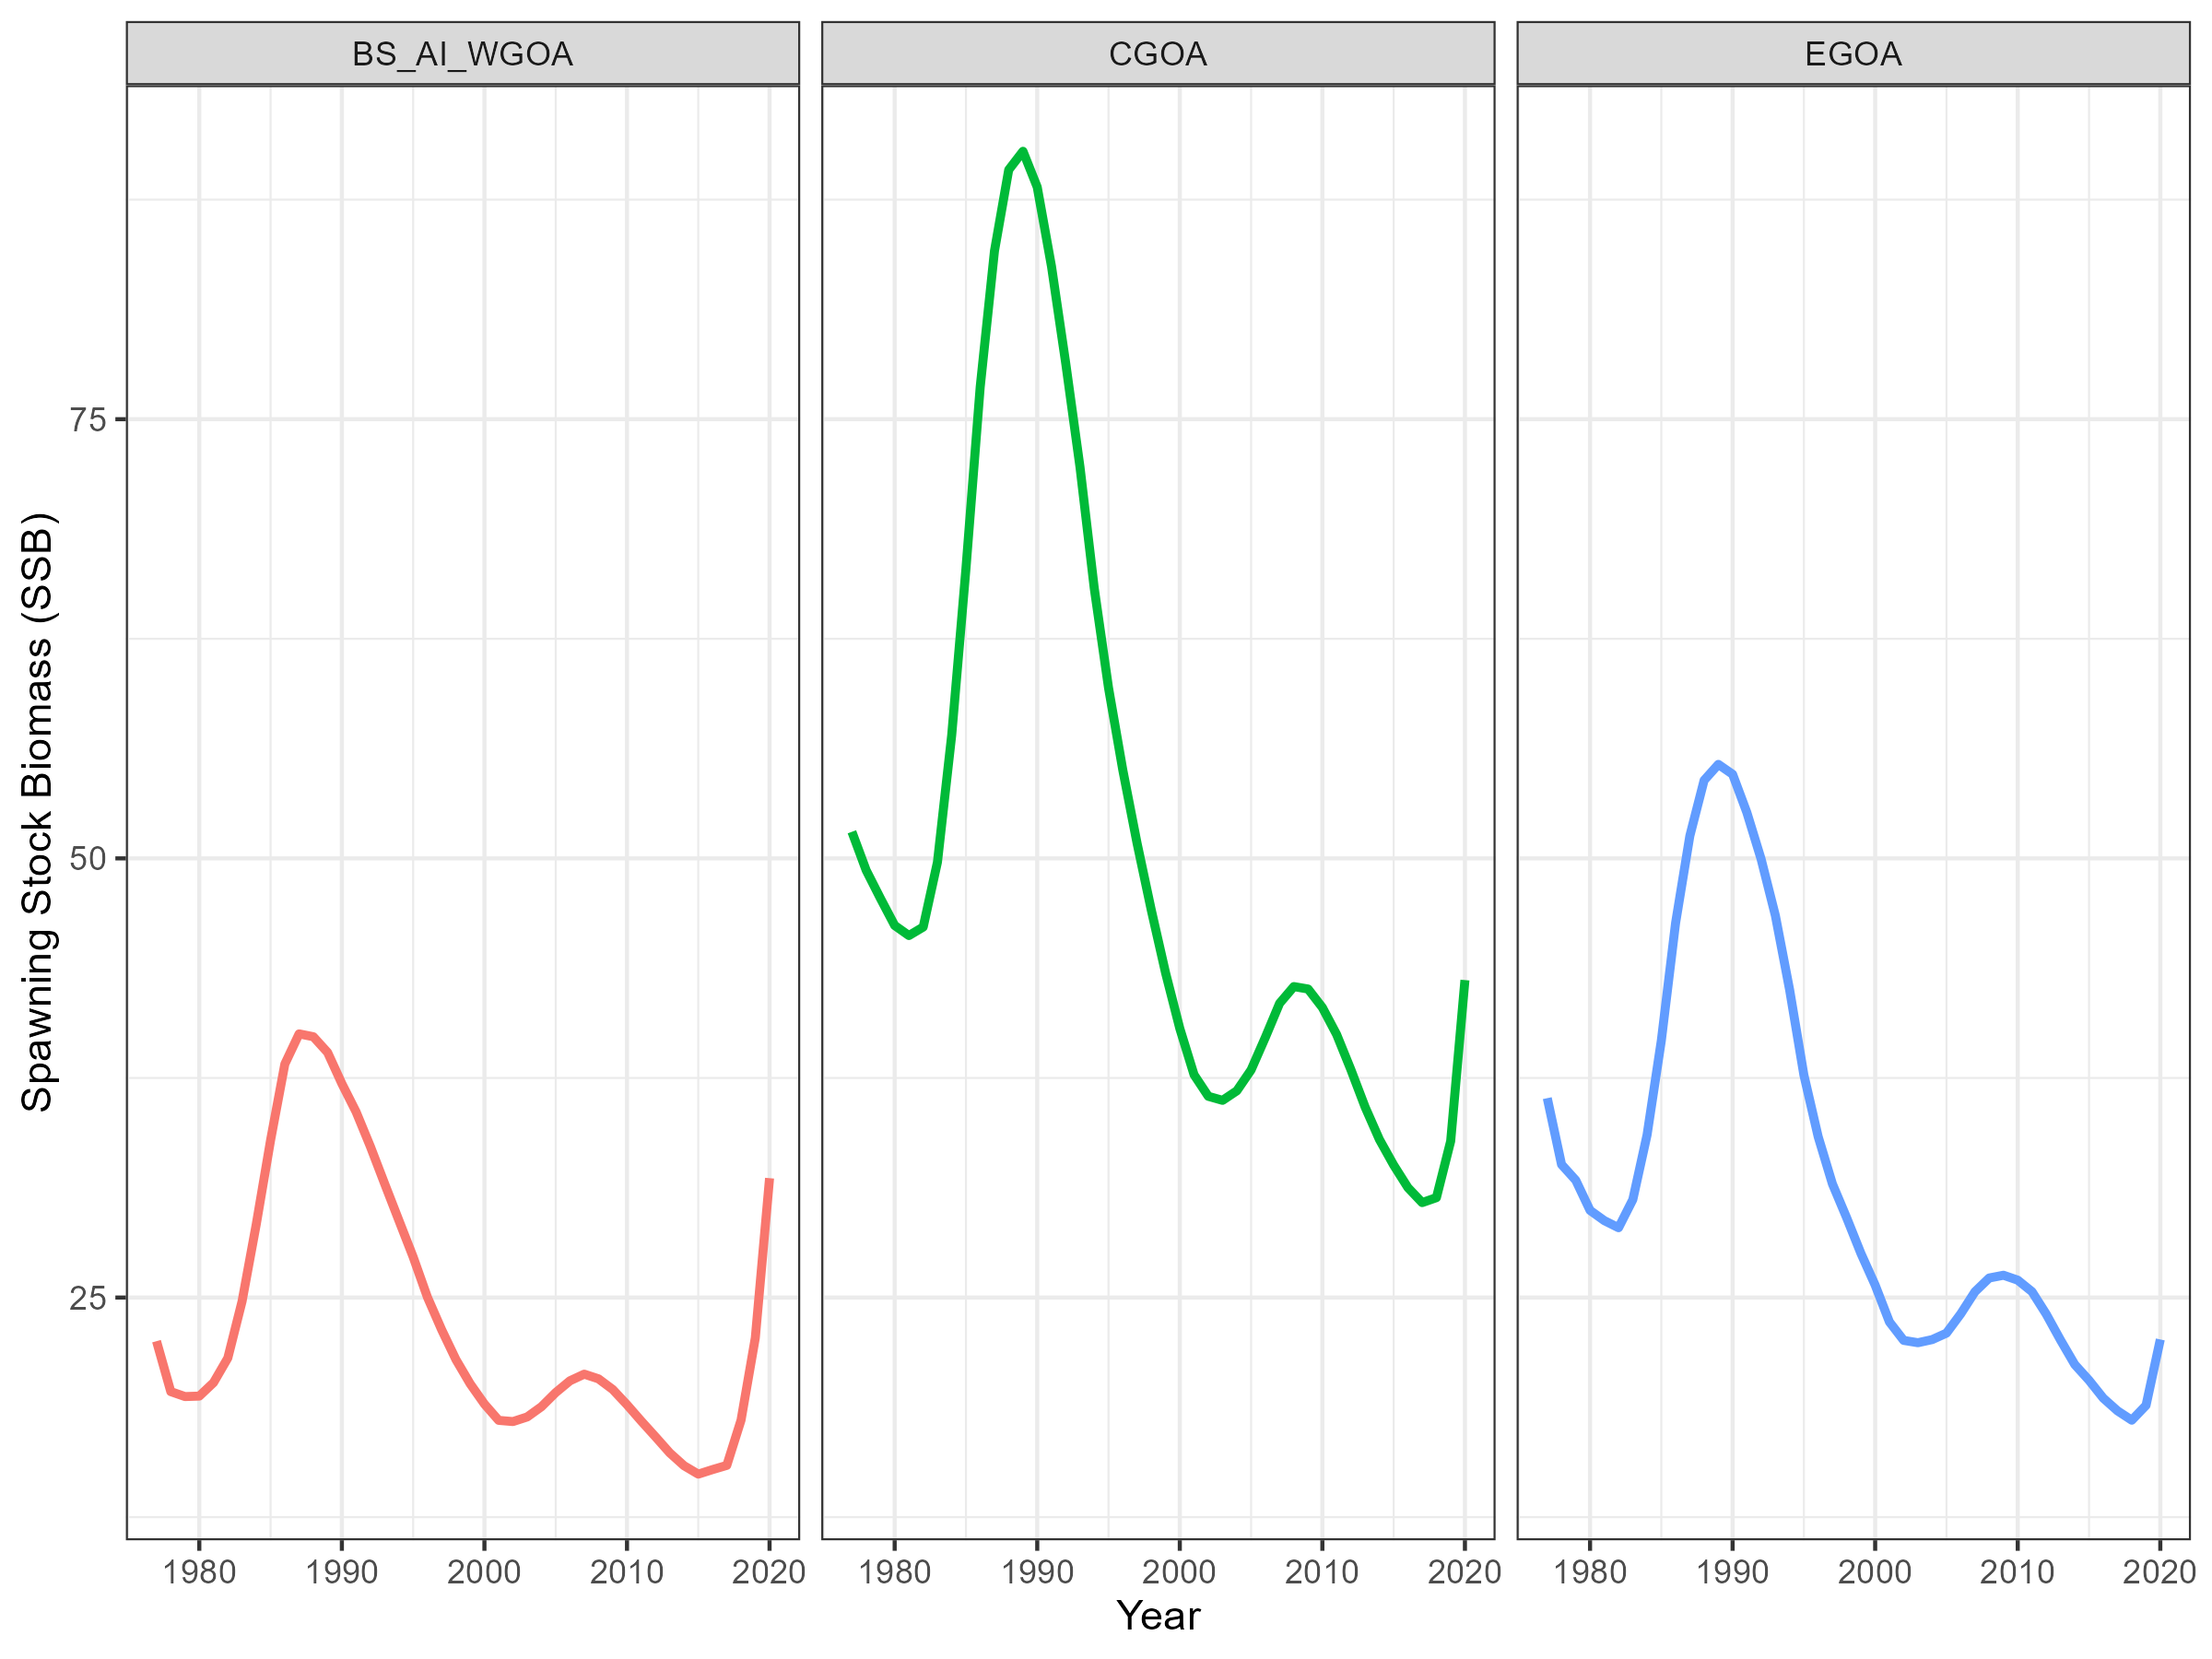
Figure 9.8: Estimated SSB in the three region model
Five area model
The initial five area model had estimated regional mean recruitment parameters, but shared a common annual recruitment deviation. All composition data has assumed multinomial likelihoods and tag-recovery data was assumed Negative Binomial.
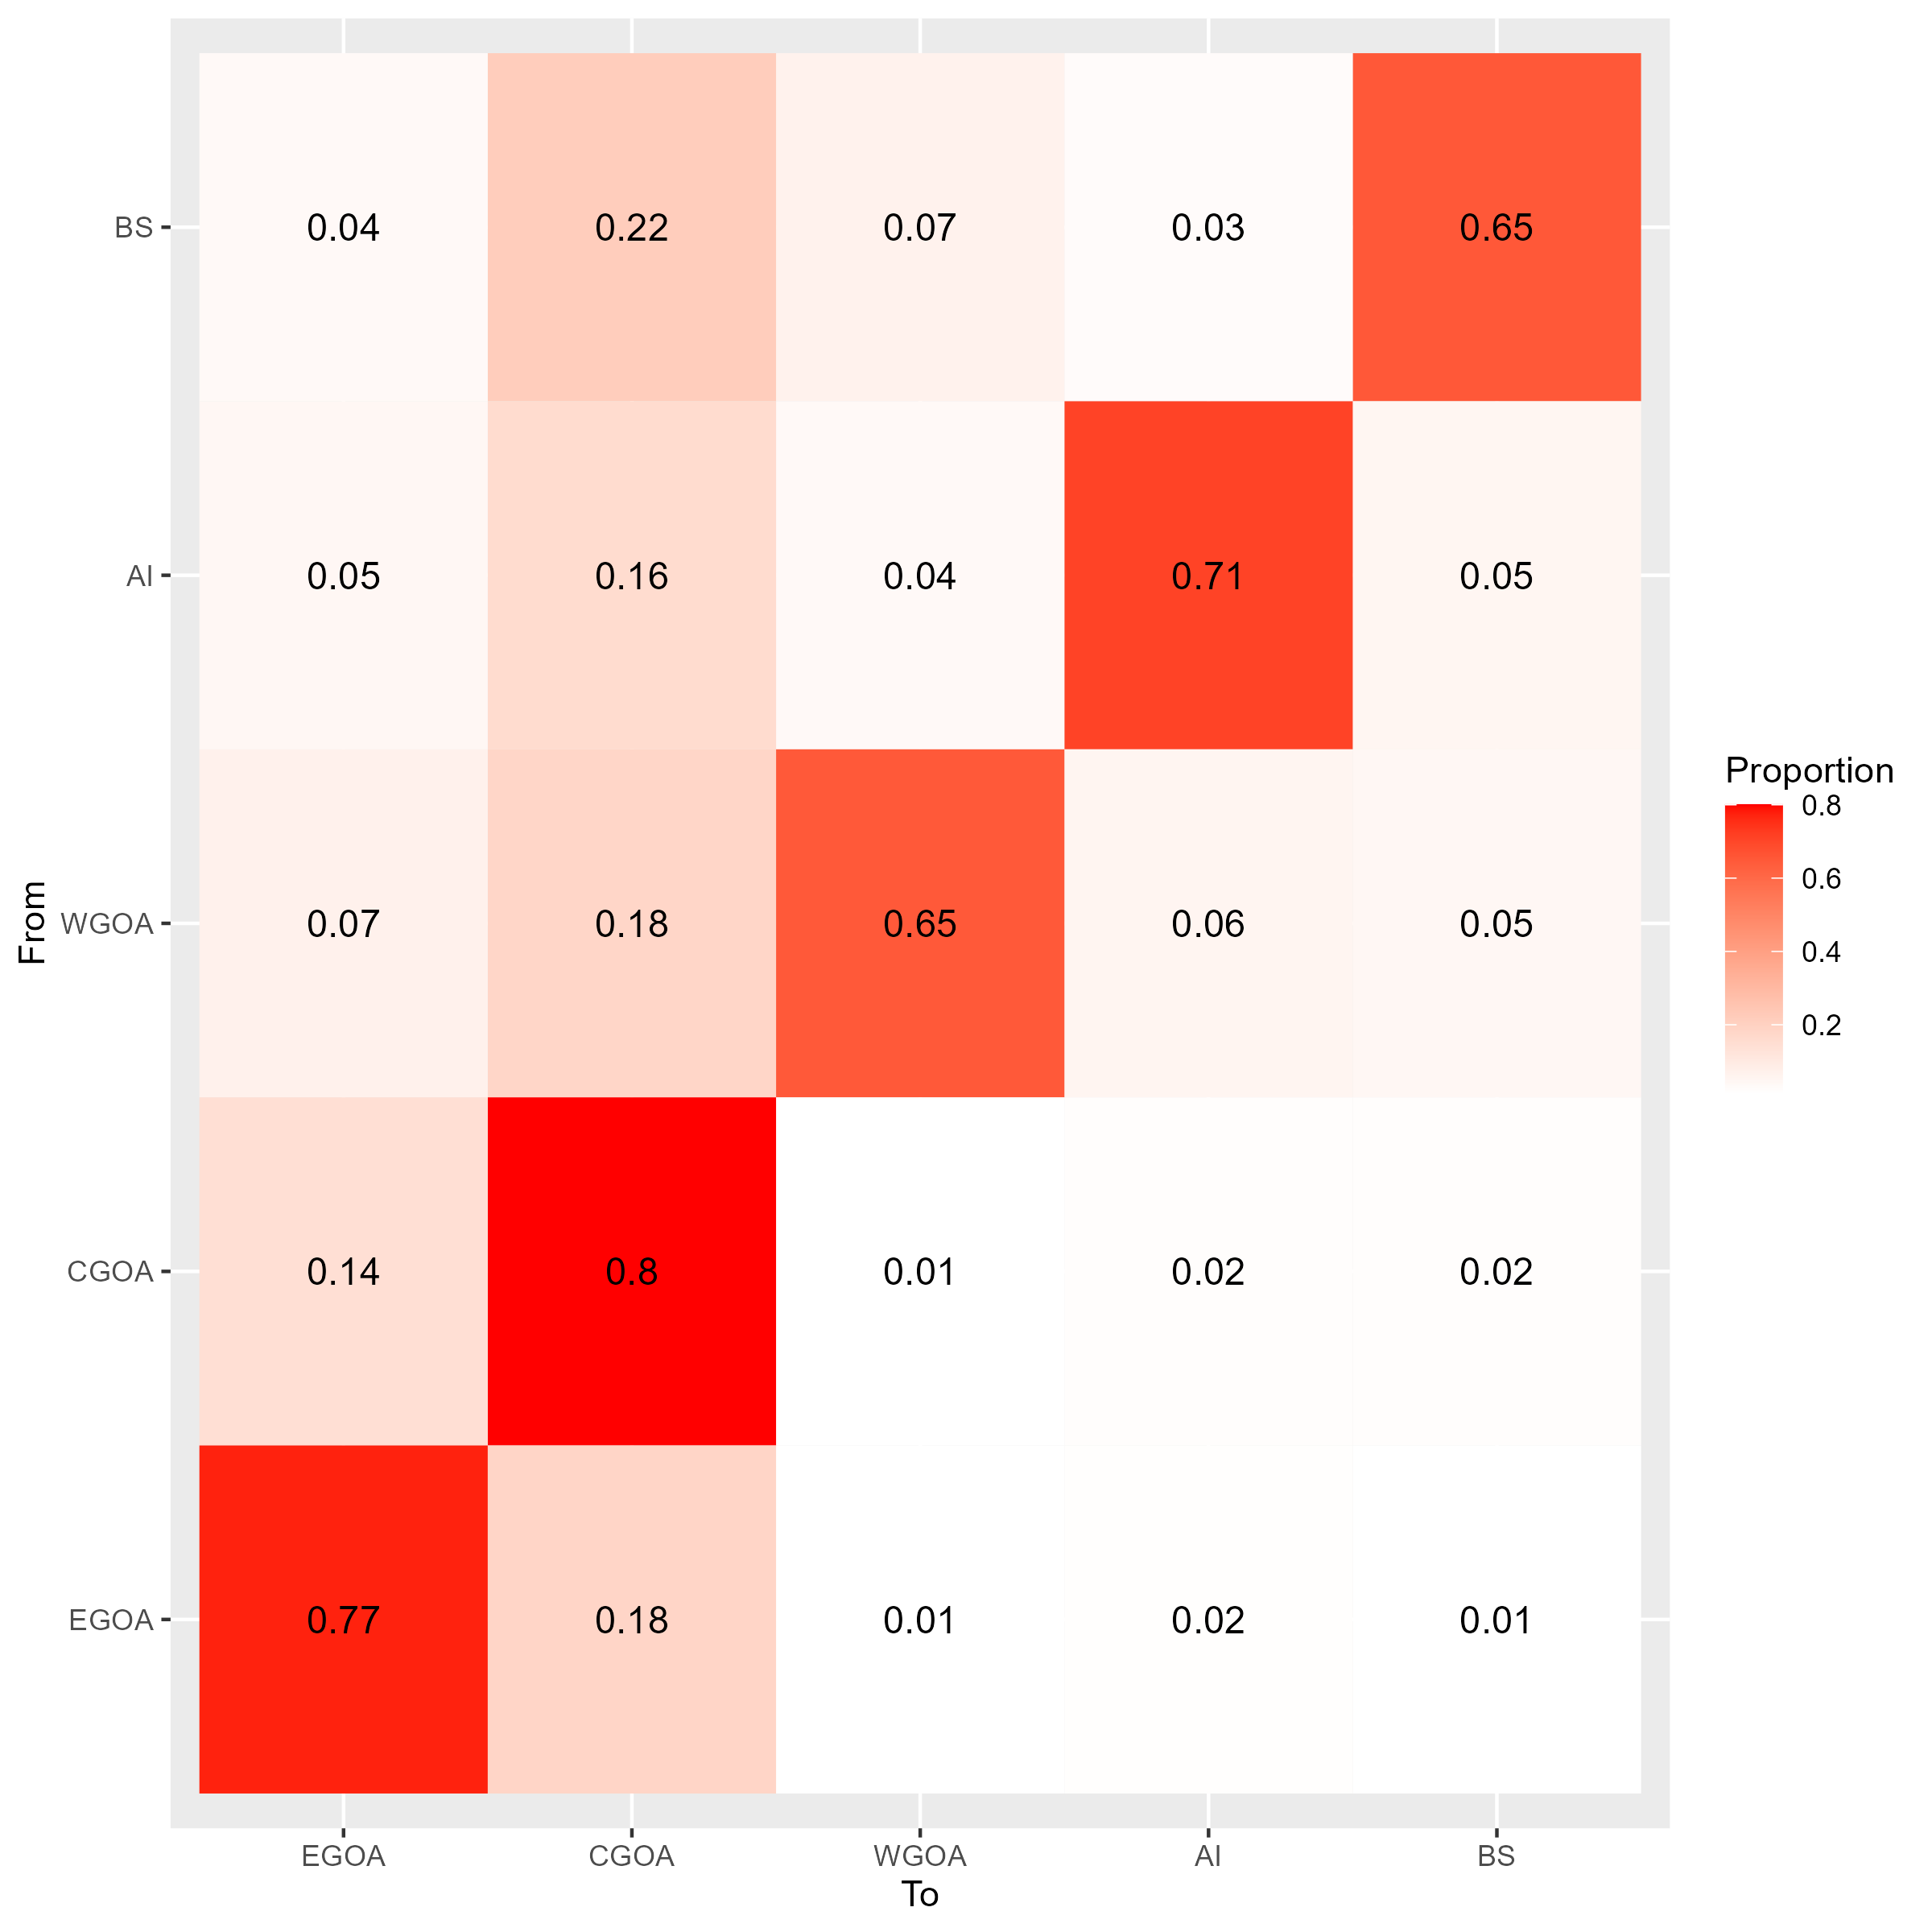
Figure 9.9: Estimated movement in the five region model
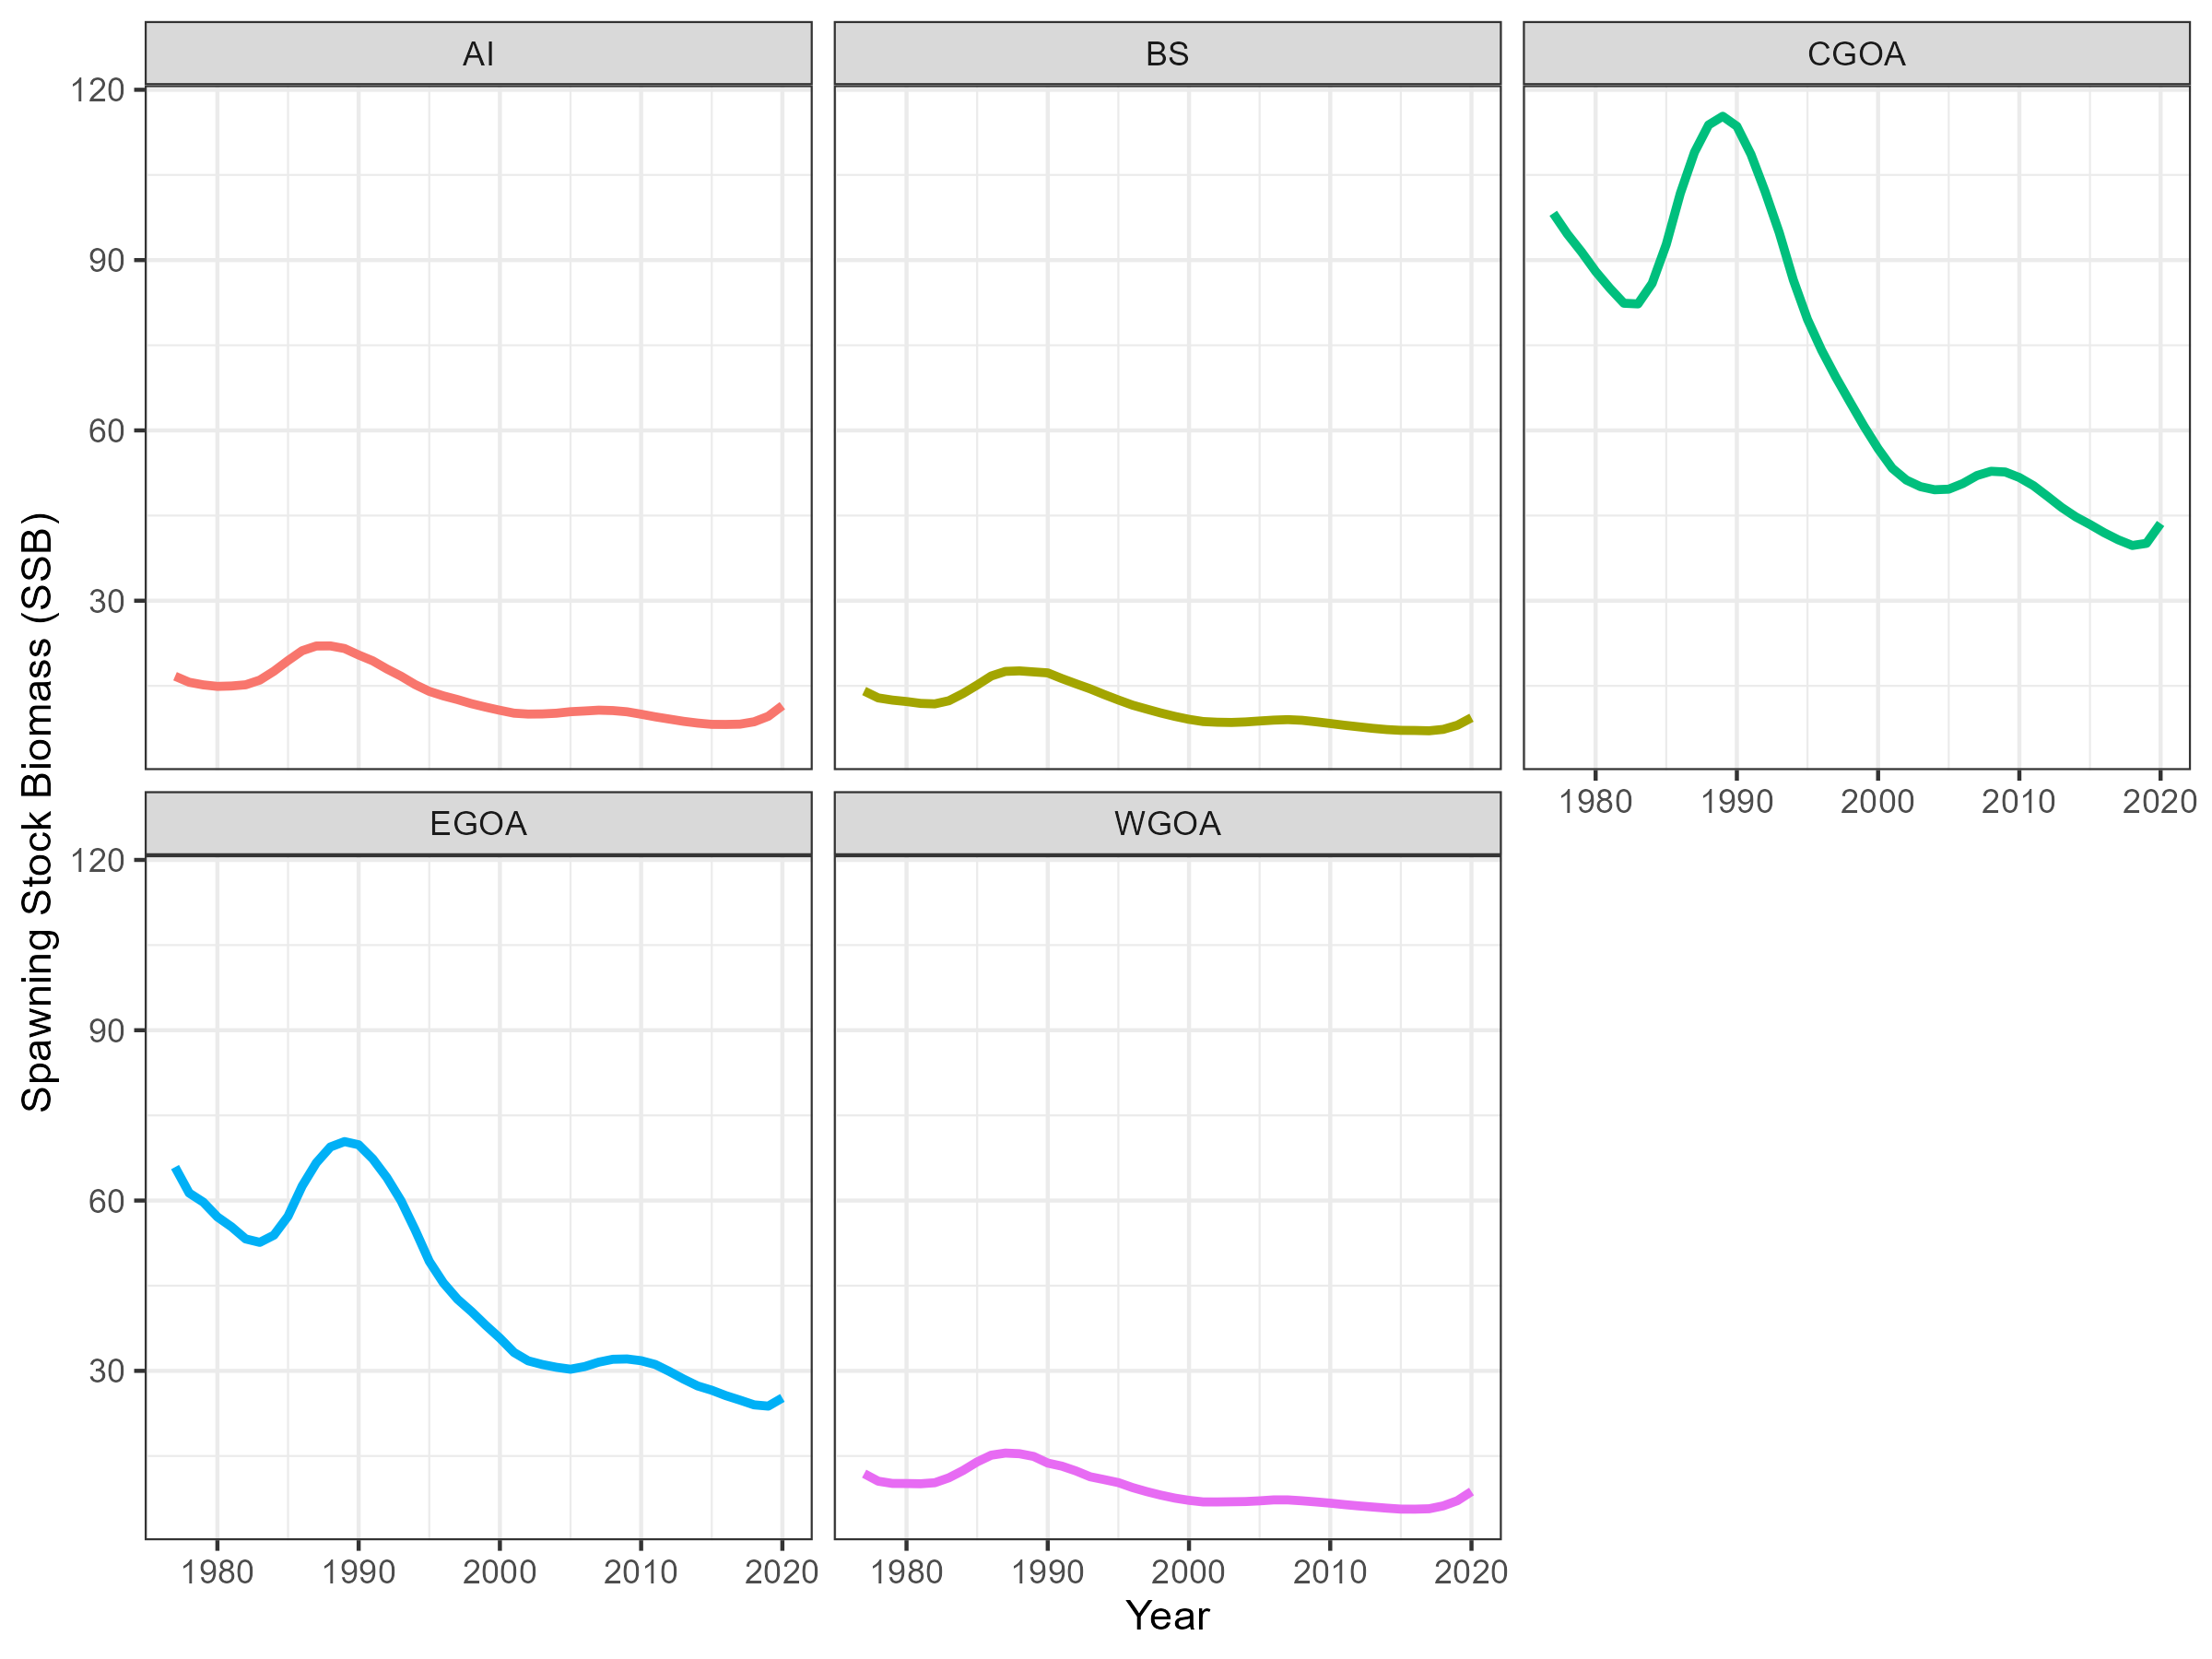
Figure 9.10: Estimated SSB in the five region model
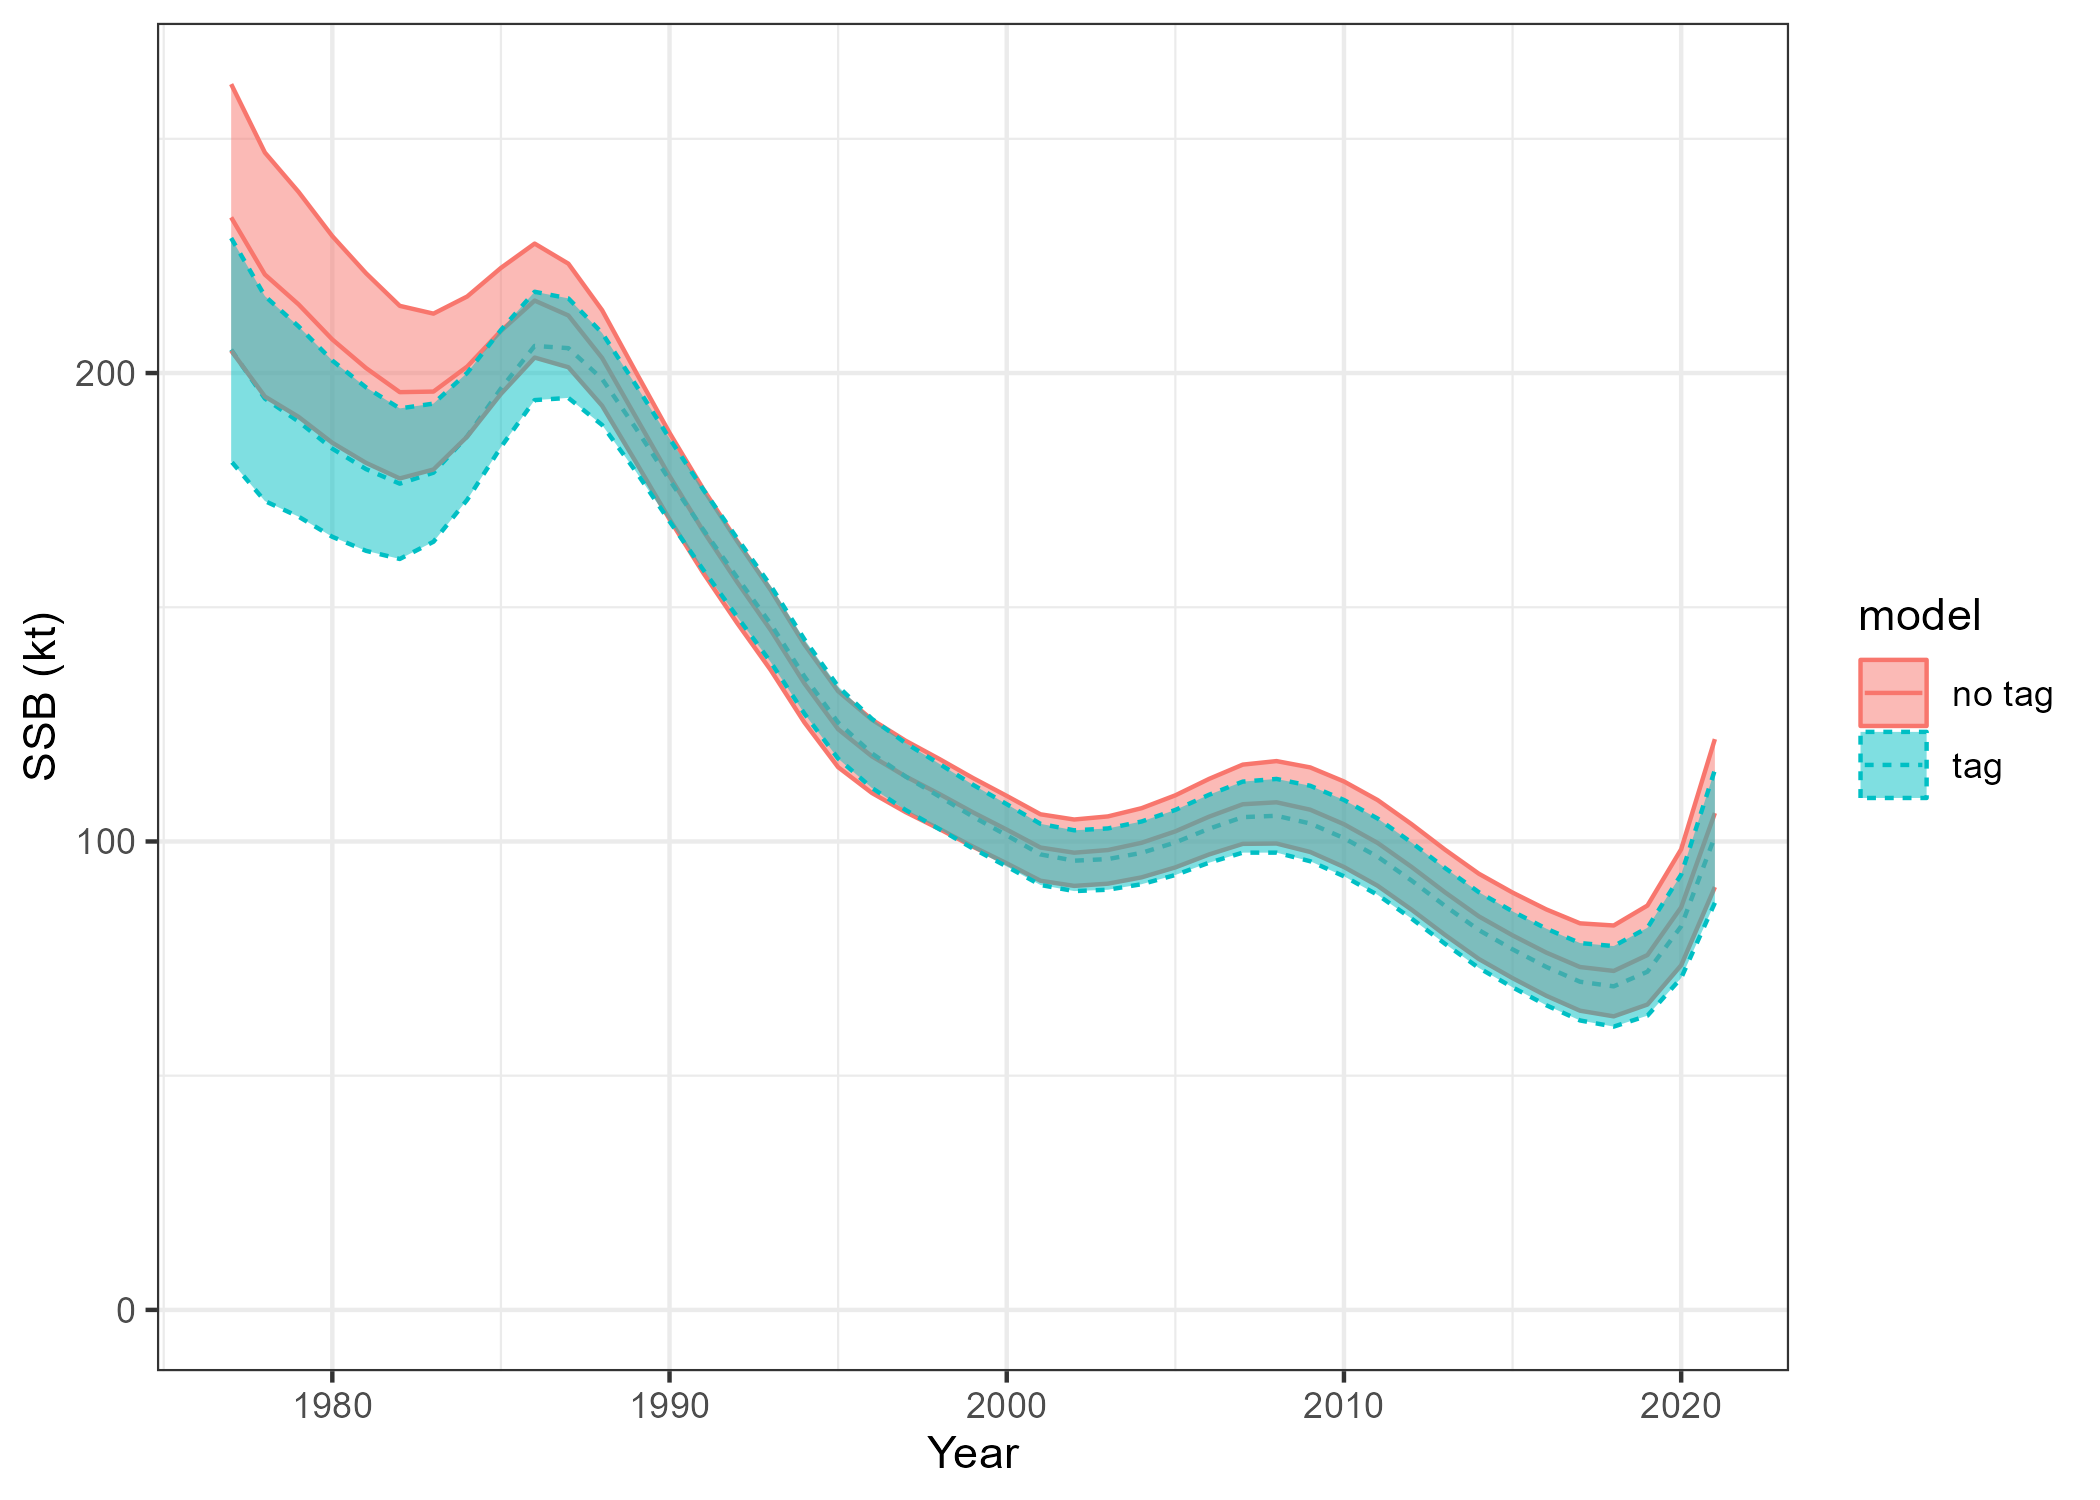
The Francis TA 1.8 data weighting method was applied. This ended up down weighting the composition data which resulted in model convergence issues. The effect on the data weighting procedure is shown in the following figure.
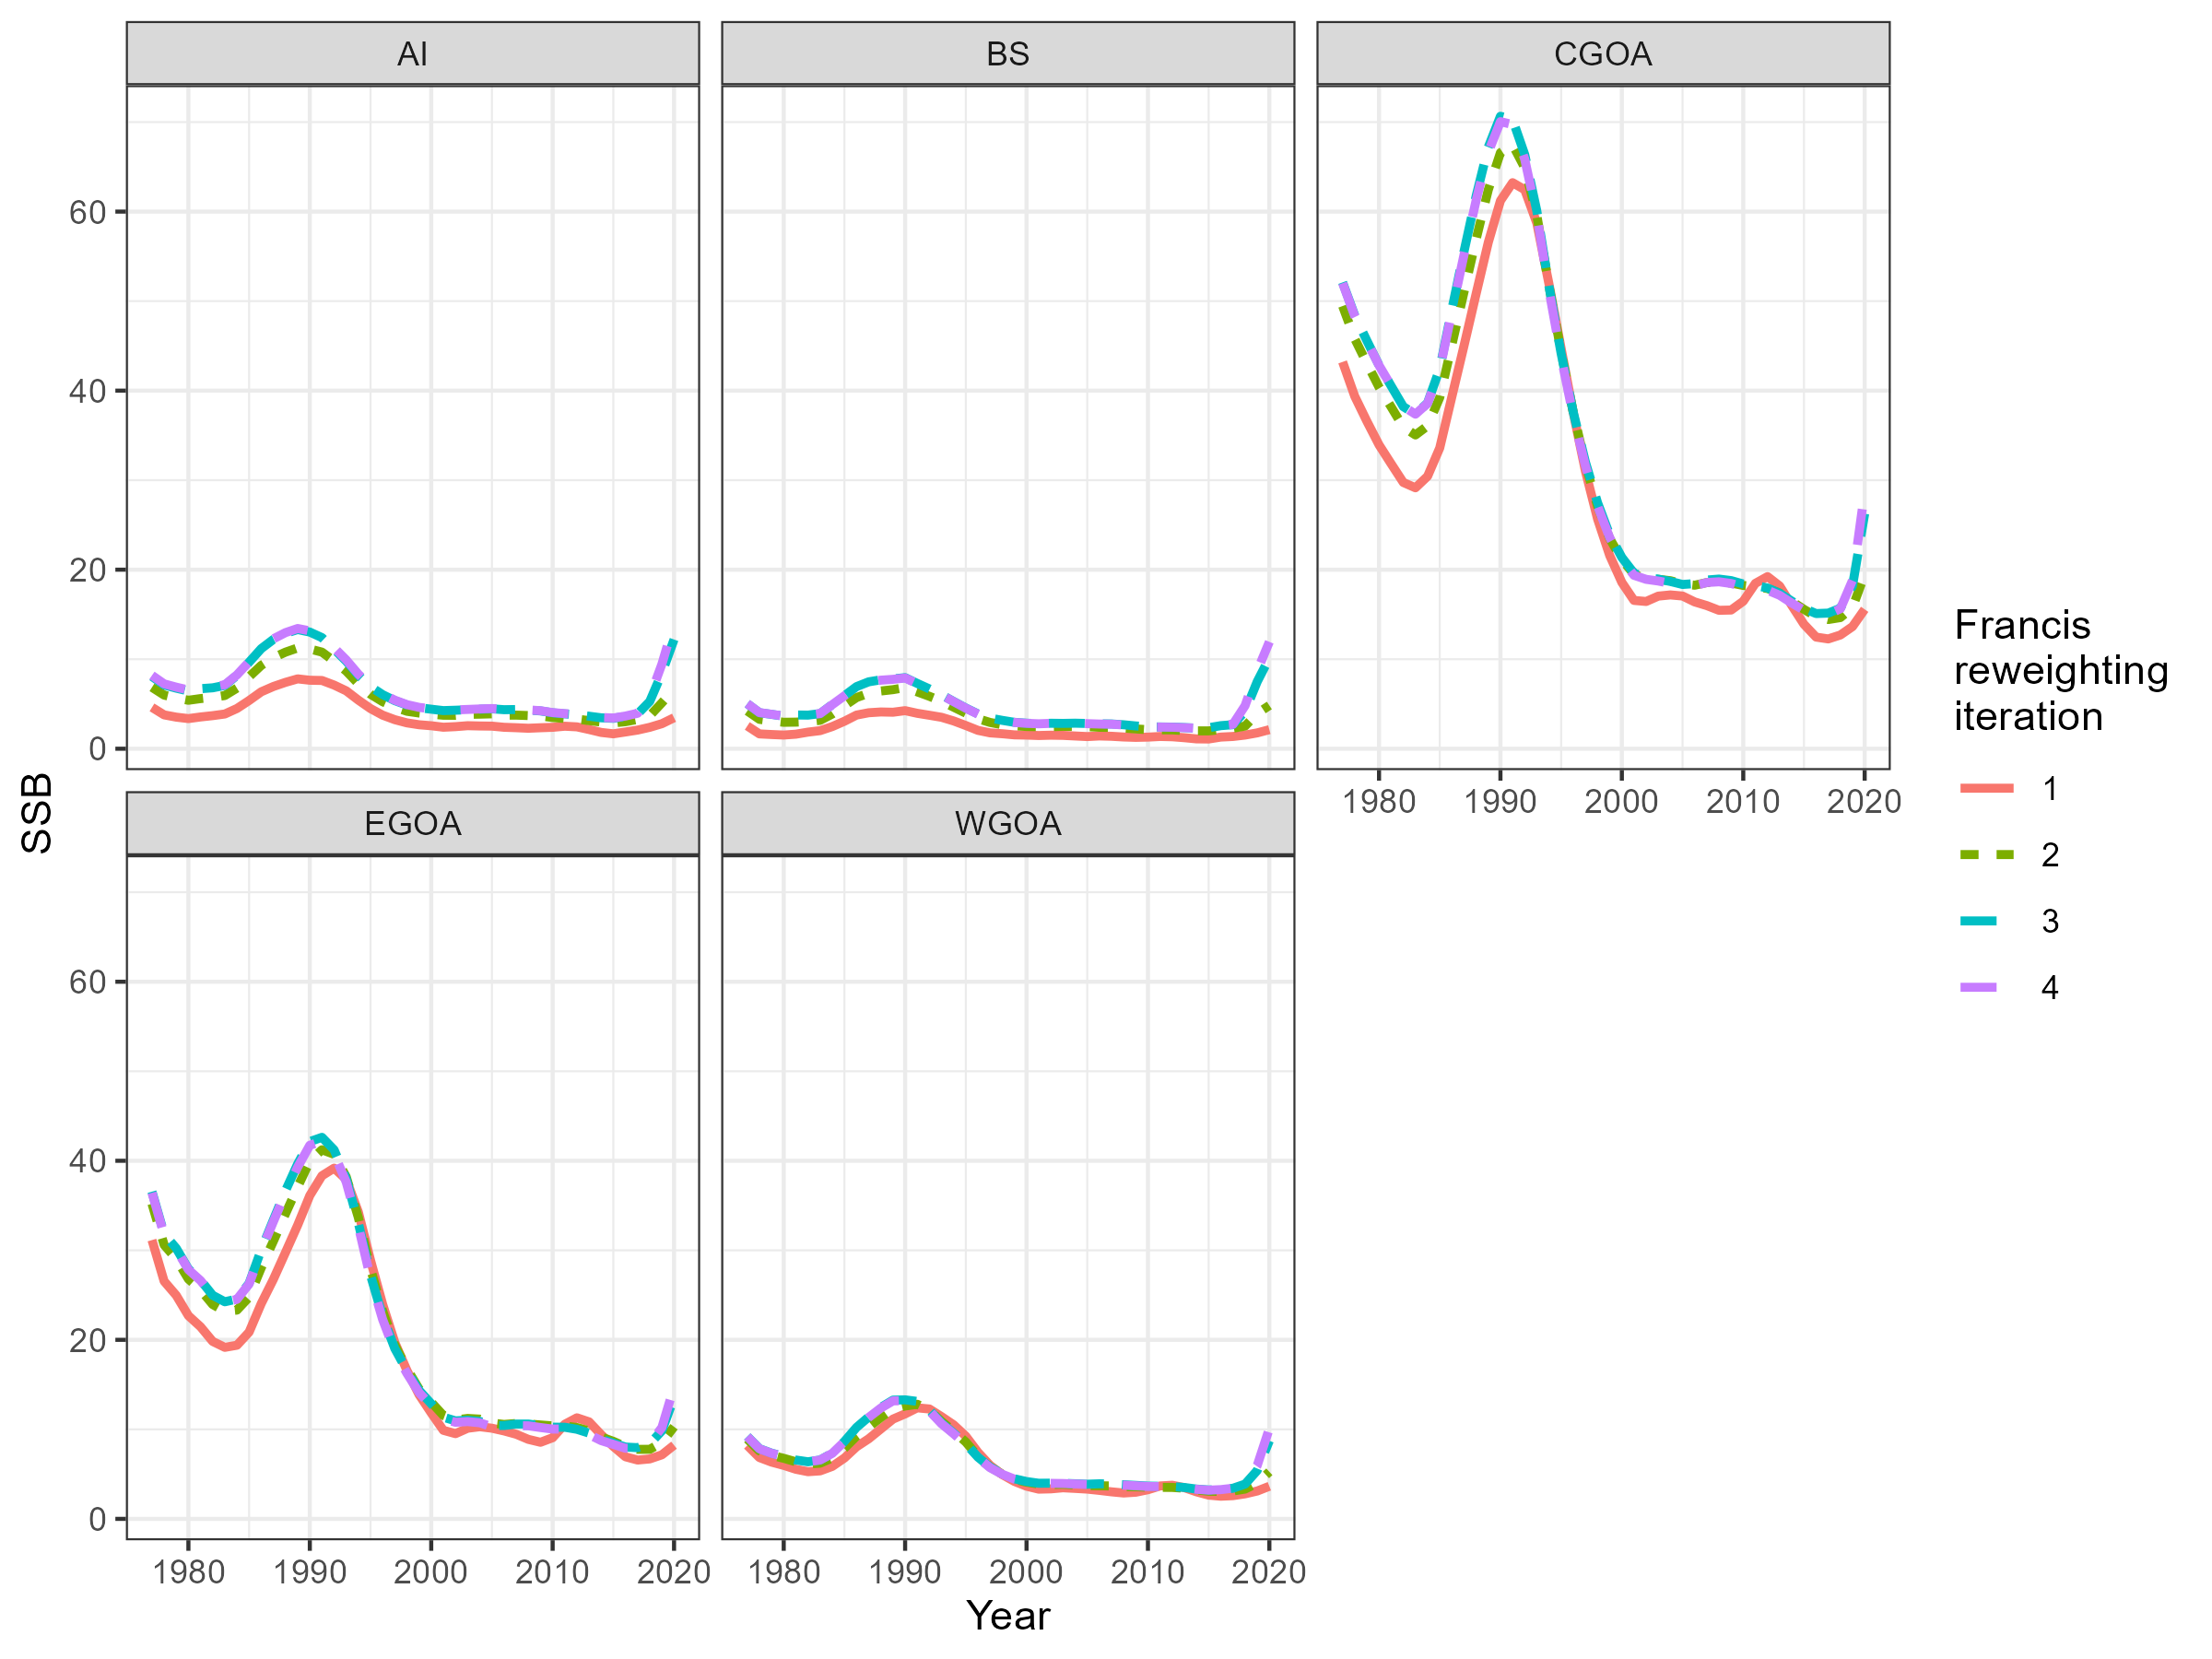
Figure 9.11: Estimated SSB in the five region model
Issues
estimating female trawl selectivity which is double normal. There are some odd LF obs i.e., EGOA 1999, BS 2013. Compare empirical LF’s between fixed gear and trawl, to see if there is much difference. Perhaps we can try a logistic. Or an alternative double normal form, I wonder if the two parameterisation is causing issues
Terminal recruitment is estimated as being unrealistically large. Add a constraint so that all recruitment deviations have to sum = 0.